We at Kharon already had built tools for deep analytical research. These tools belonged to the "ClearView" product and were in heavy use by analysts at JP Morgan, Deutsche Bank, and the US Treasury.
We knew that building a narrative-driven application was going to be a different challenge altogether. We had to turn raw numbers into compelling stories about entities that could exist anywhere in the world.
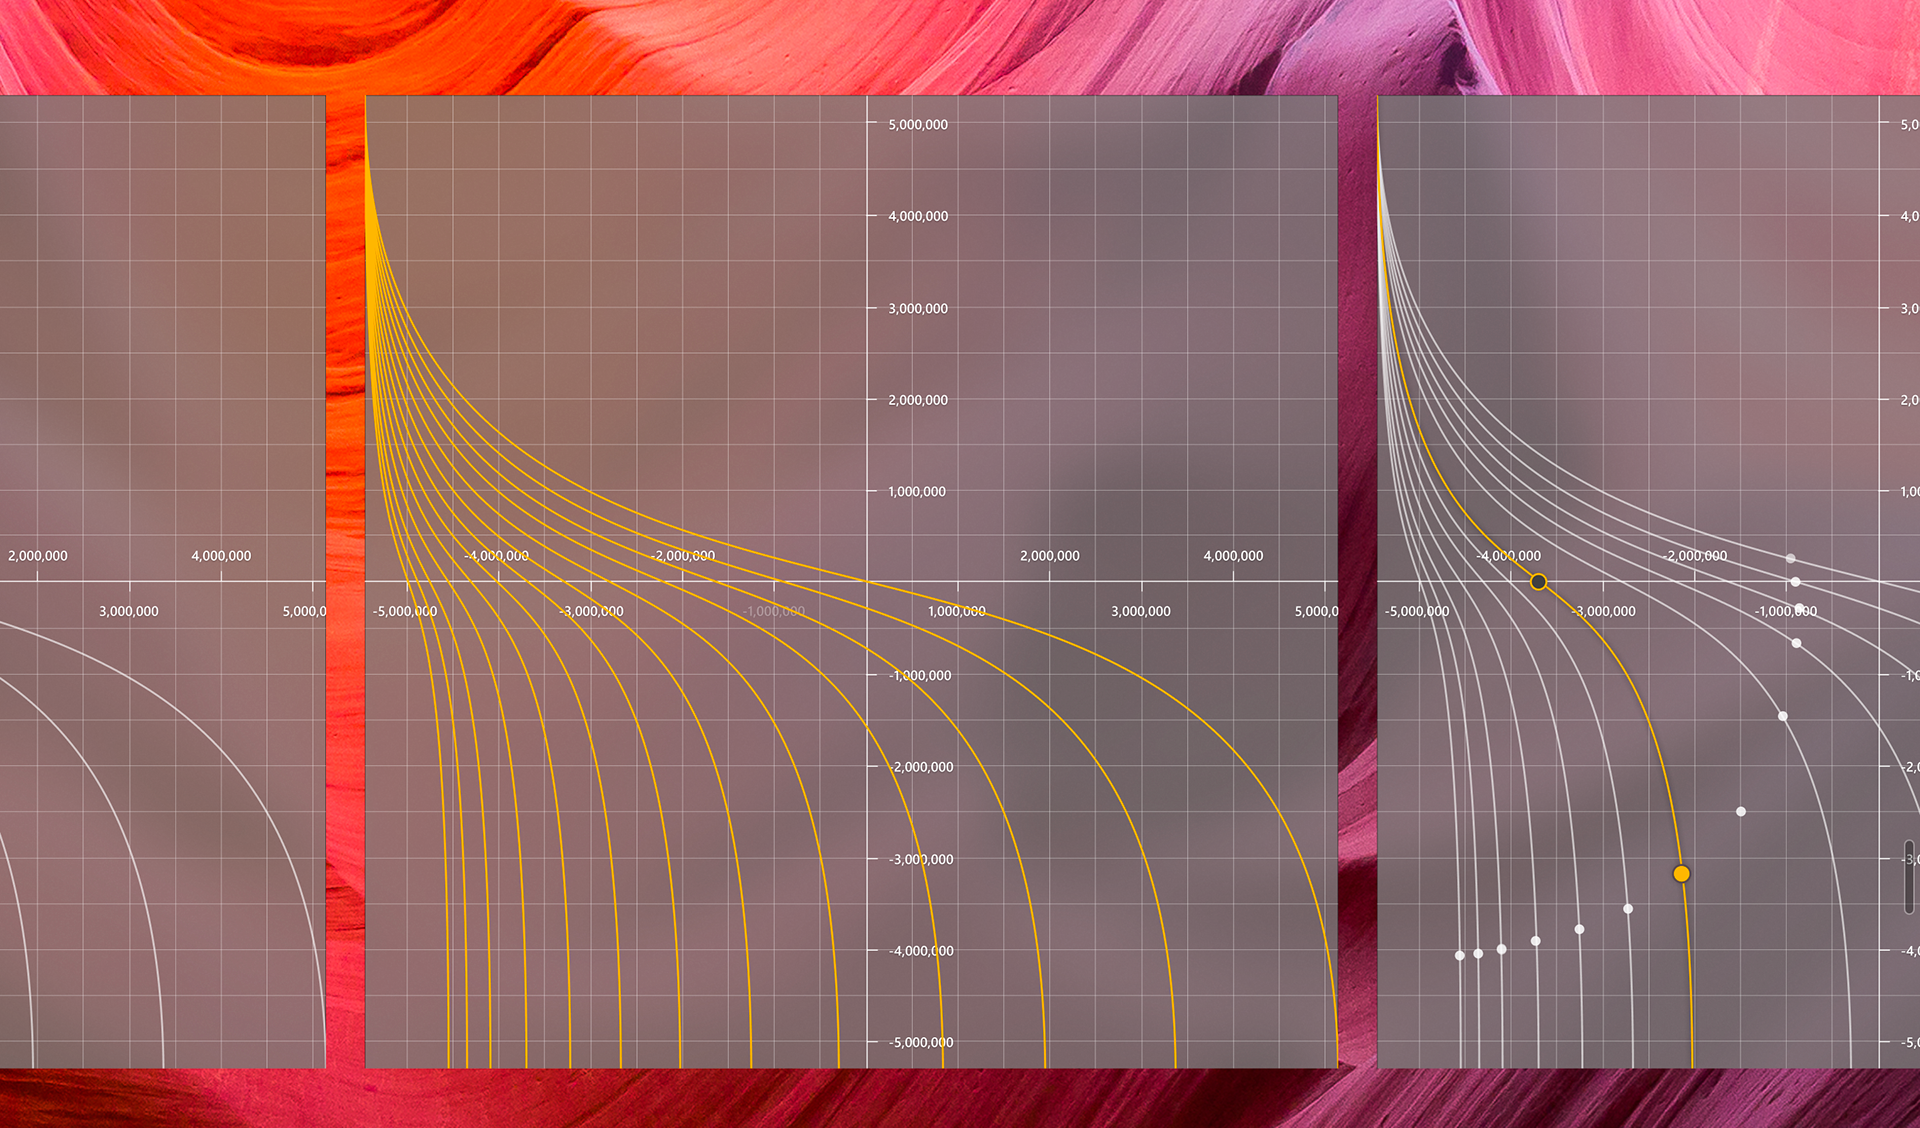
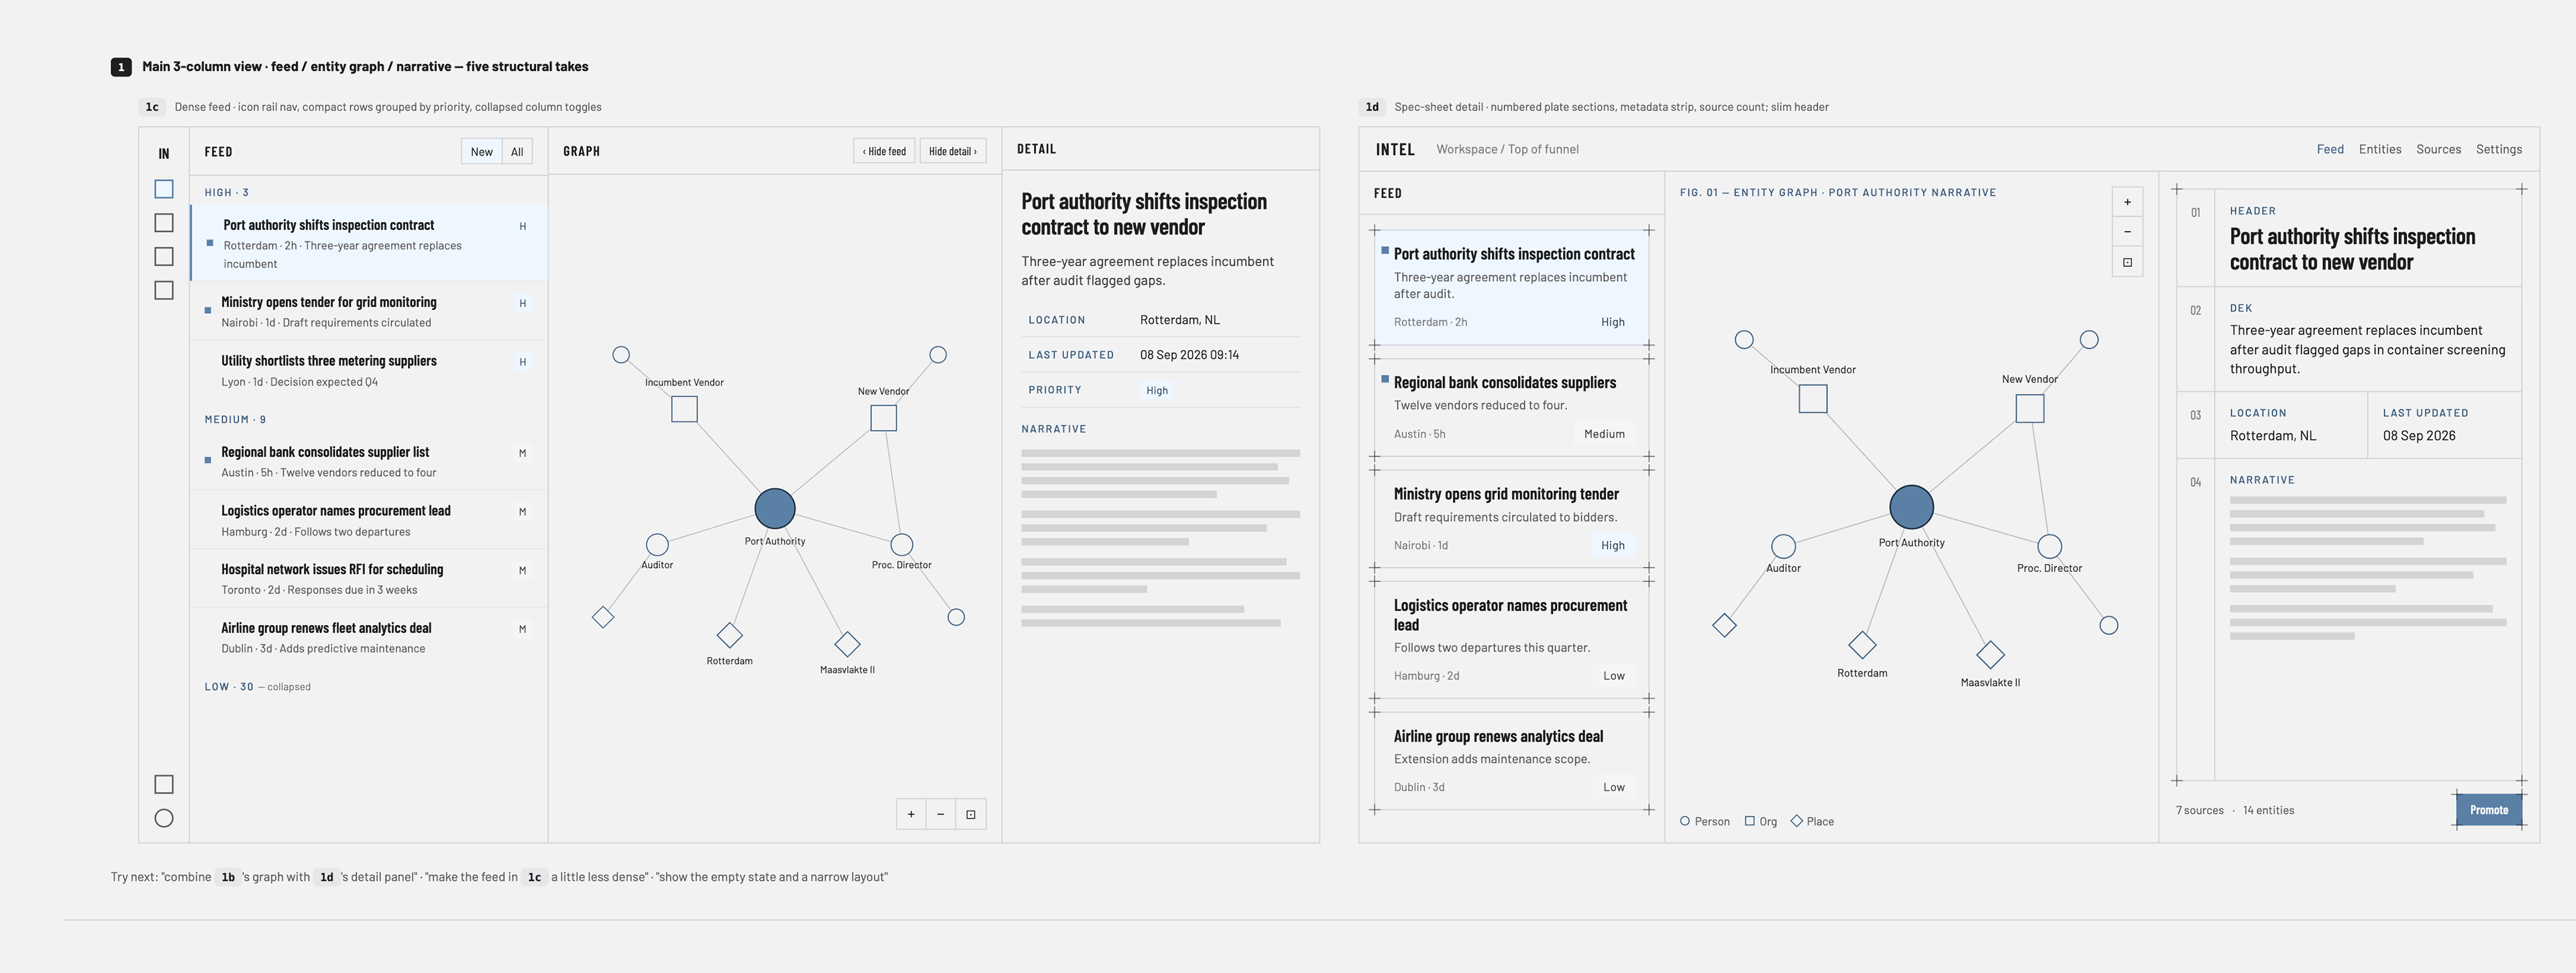
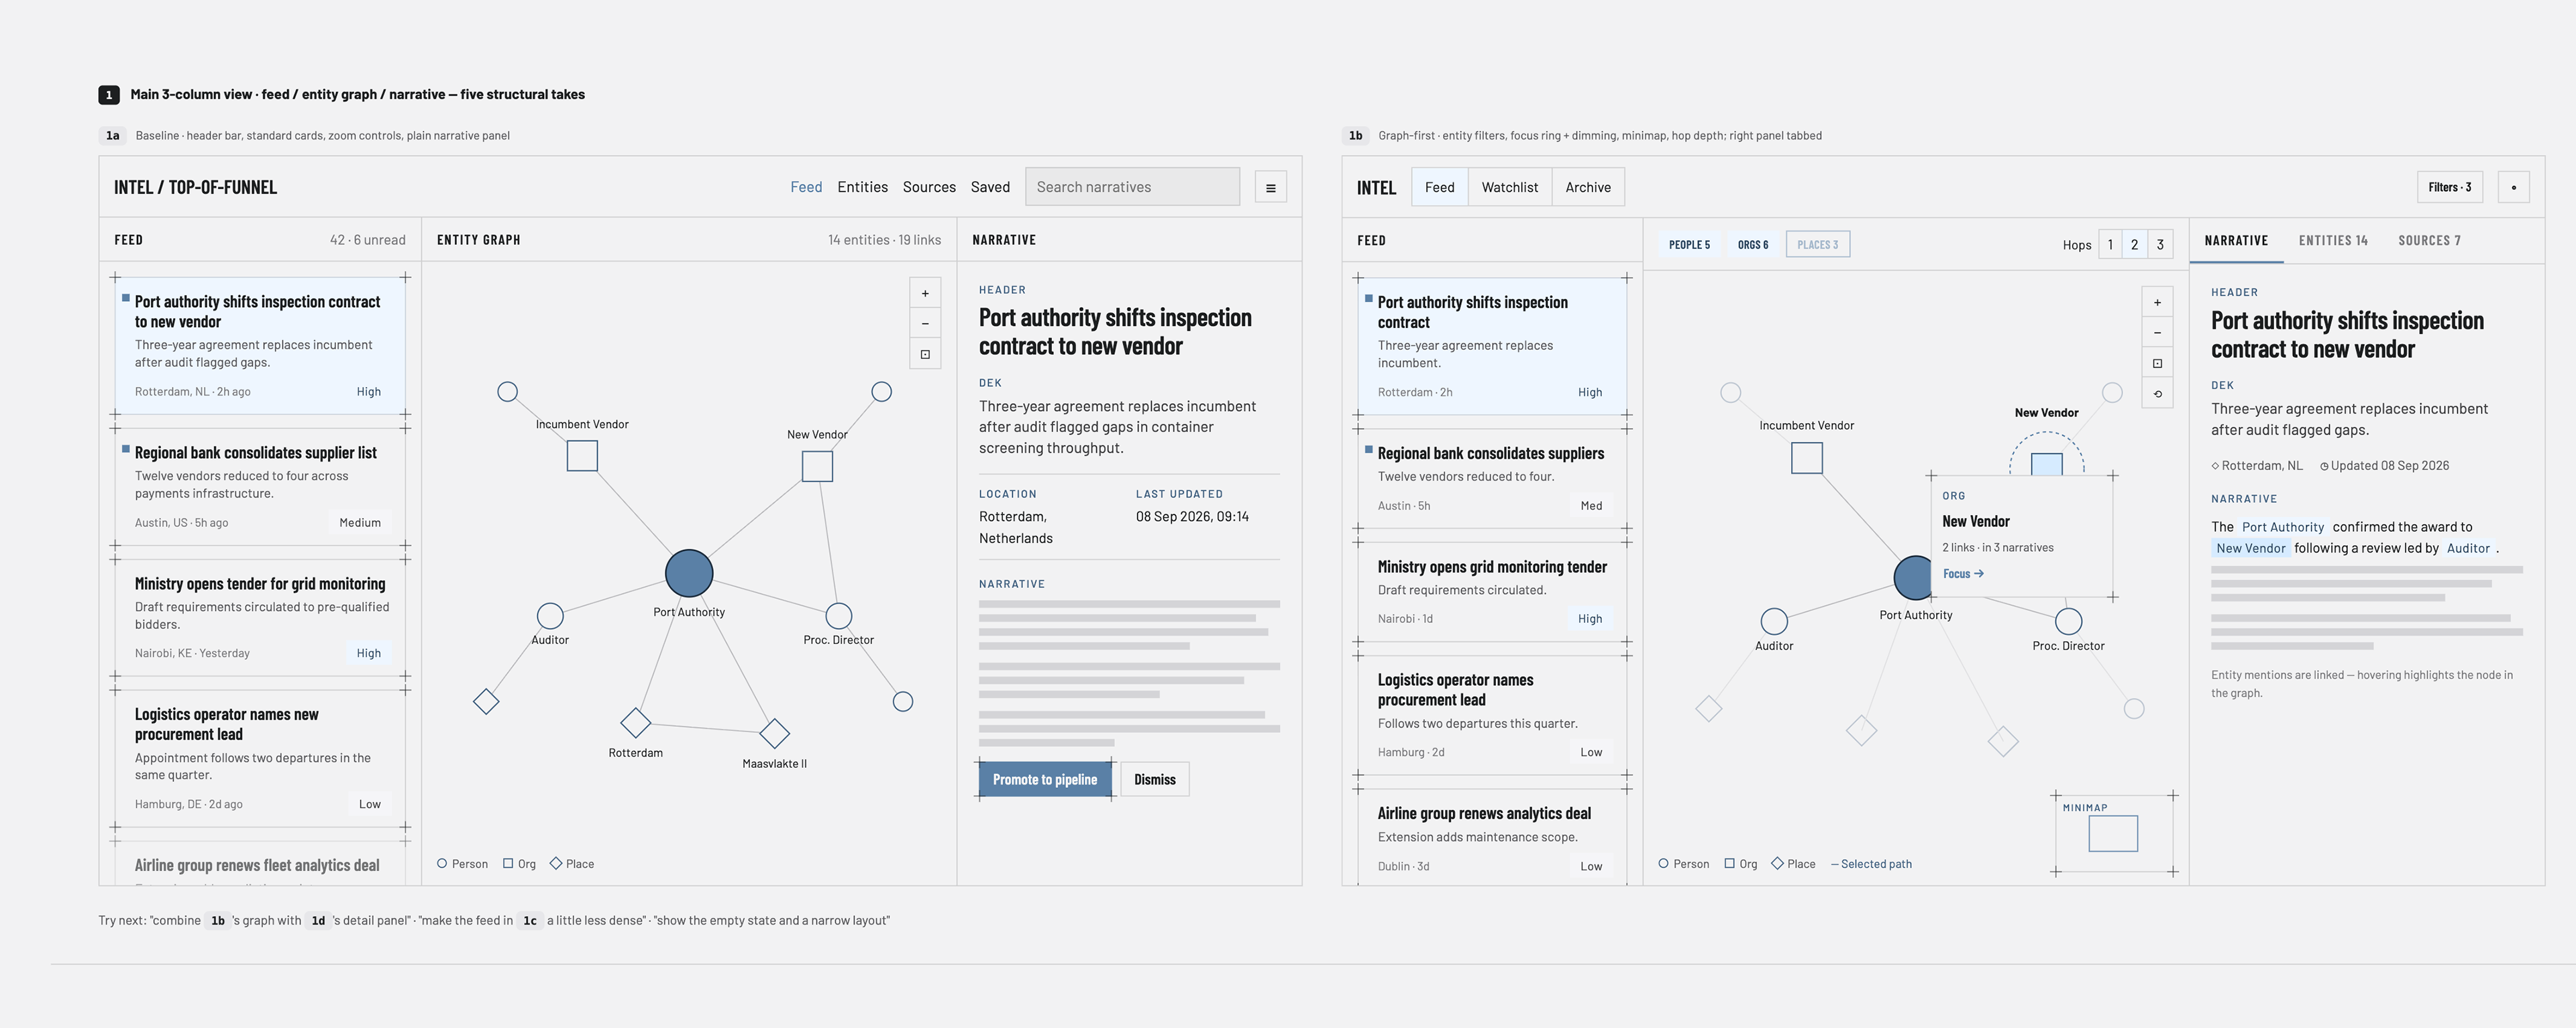
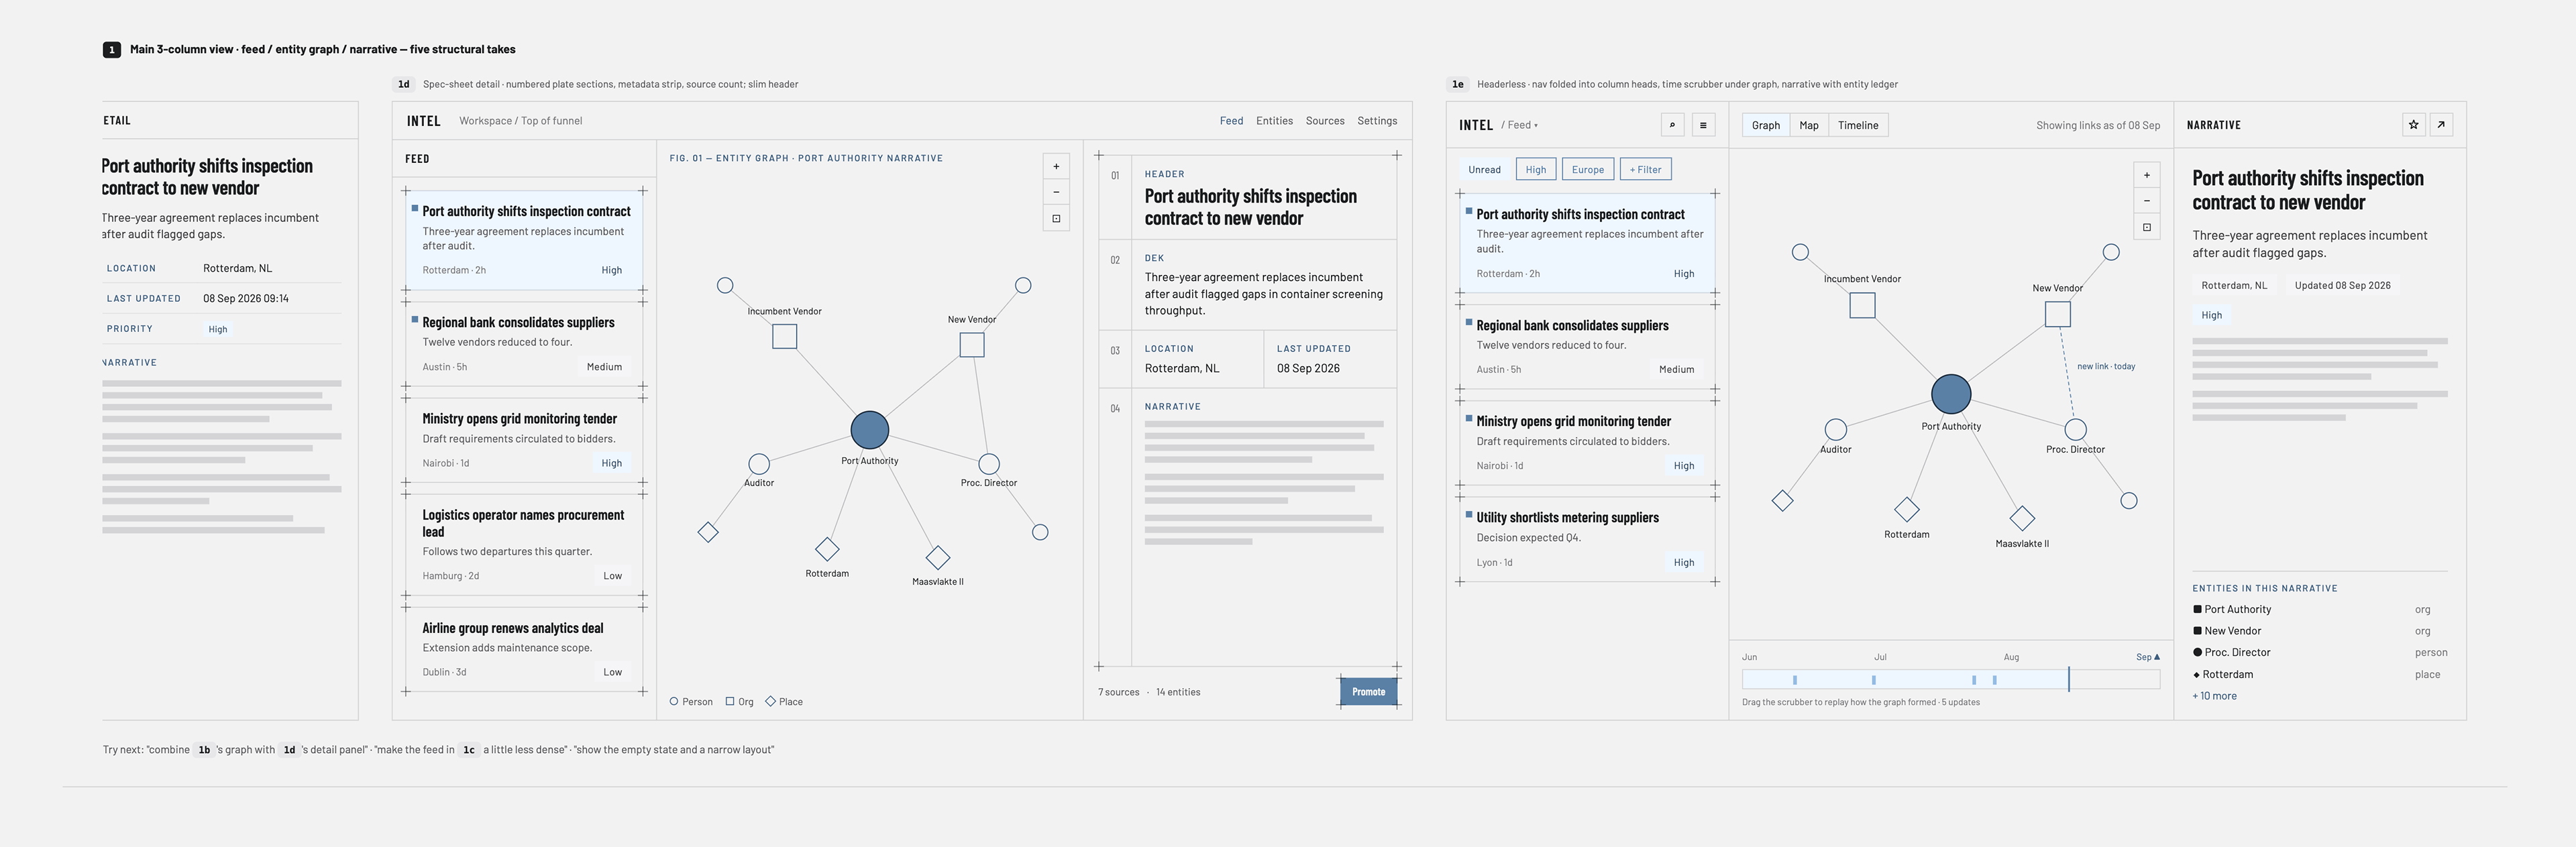
An early visual exploration.
AI Wireframing
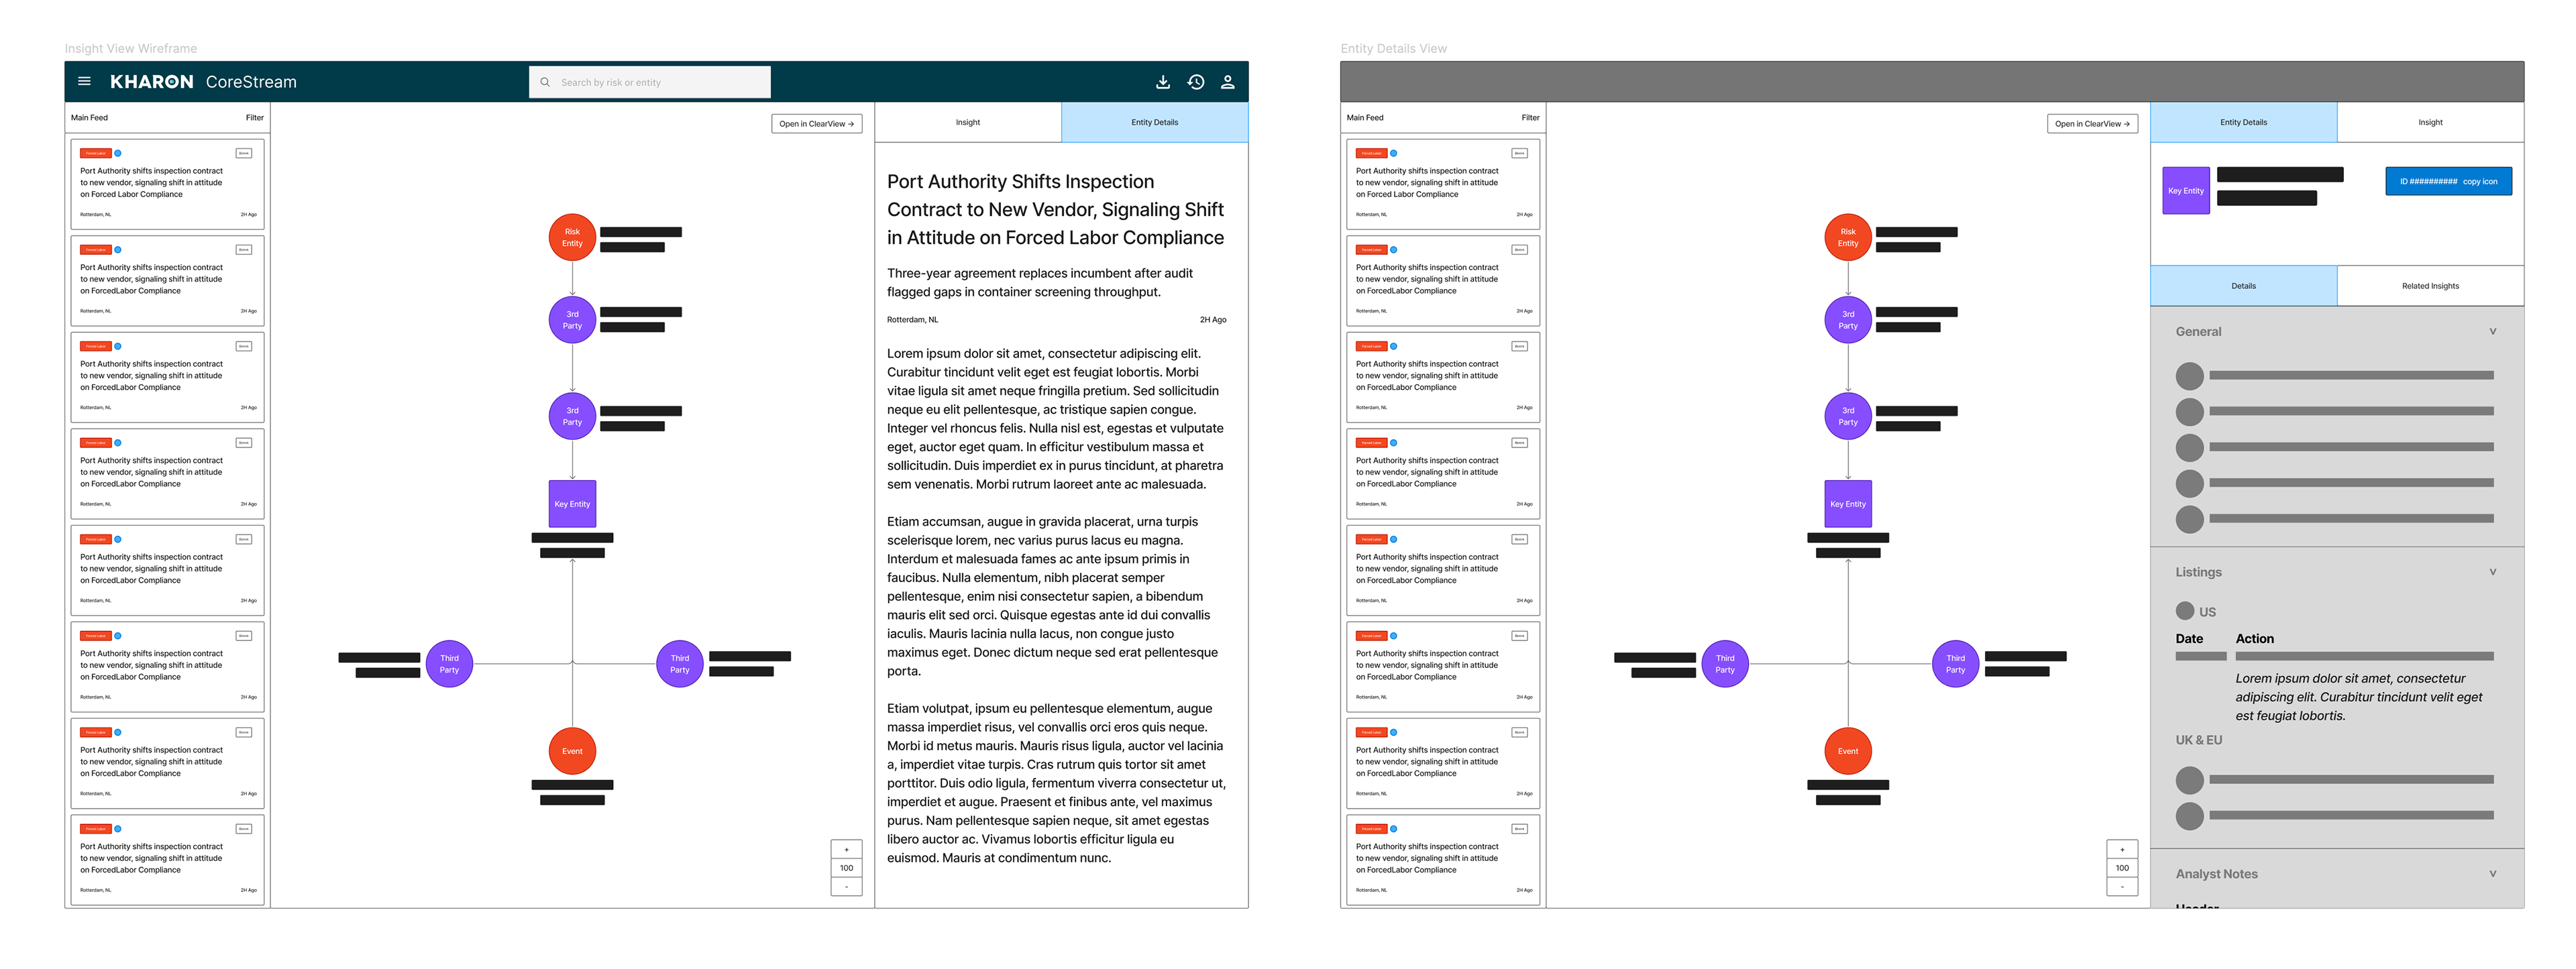
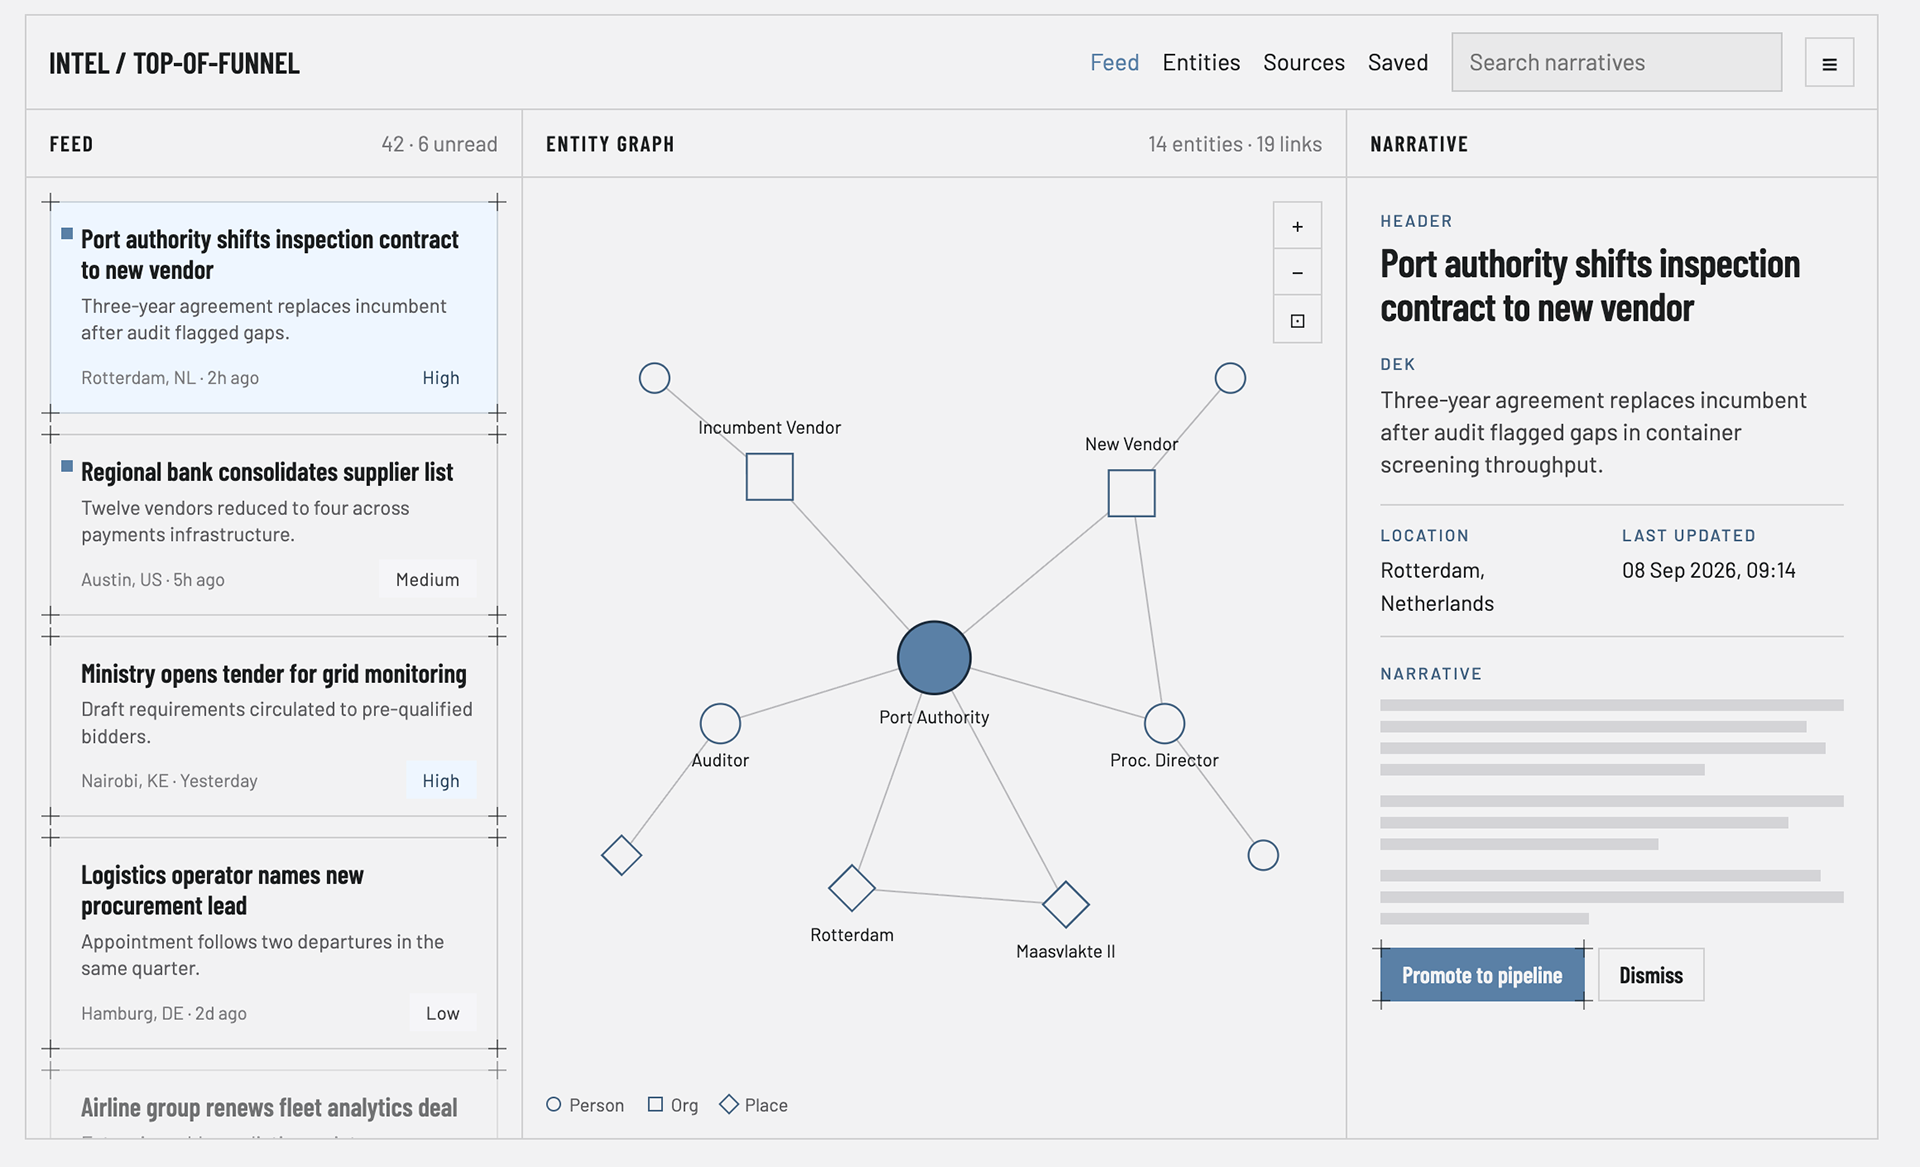
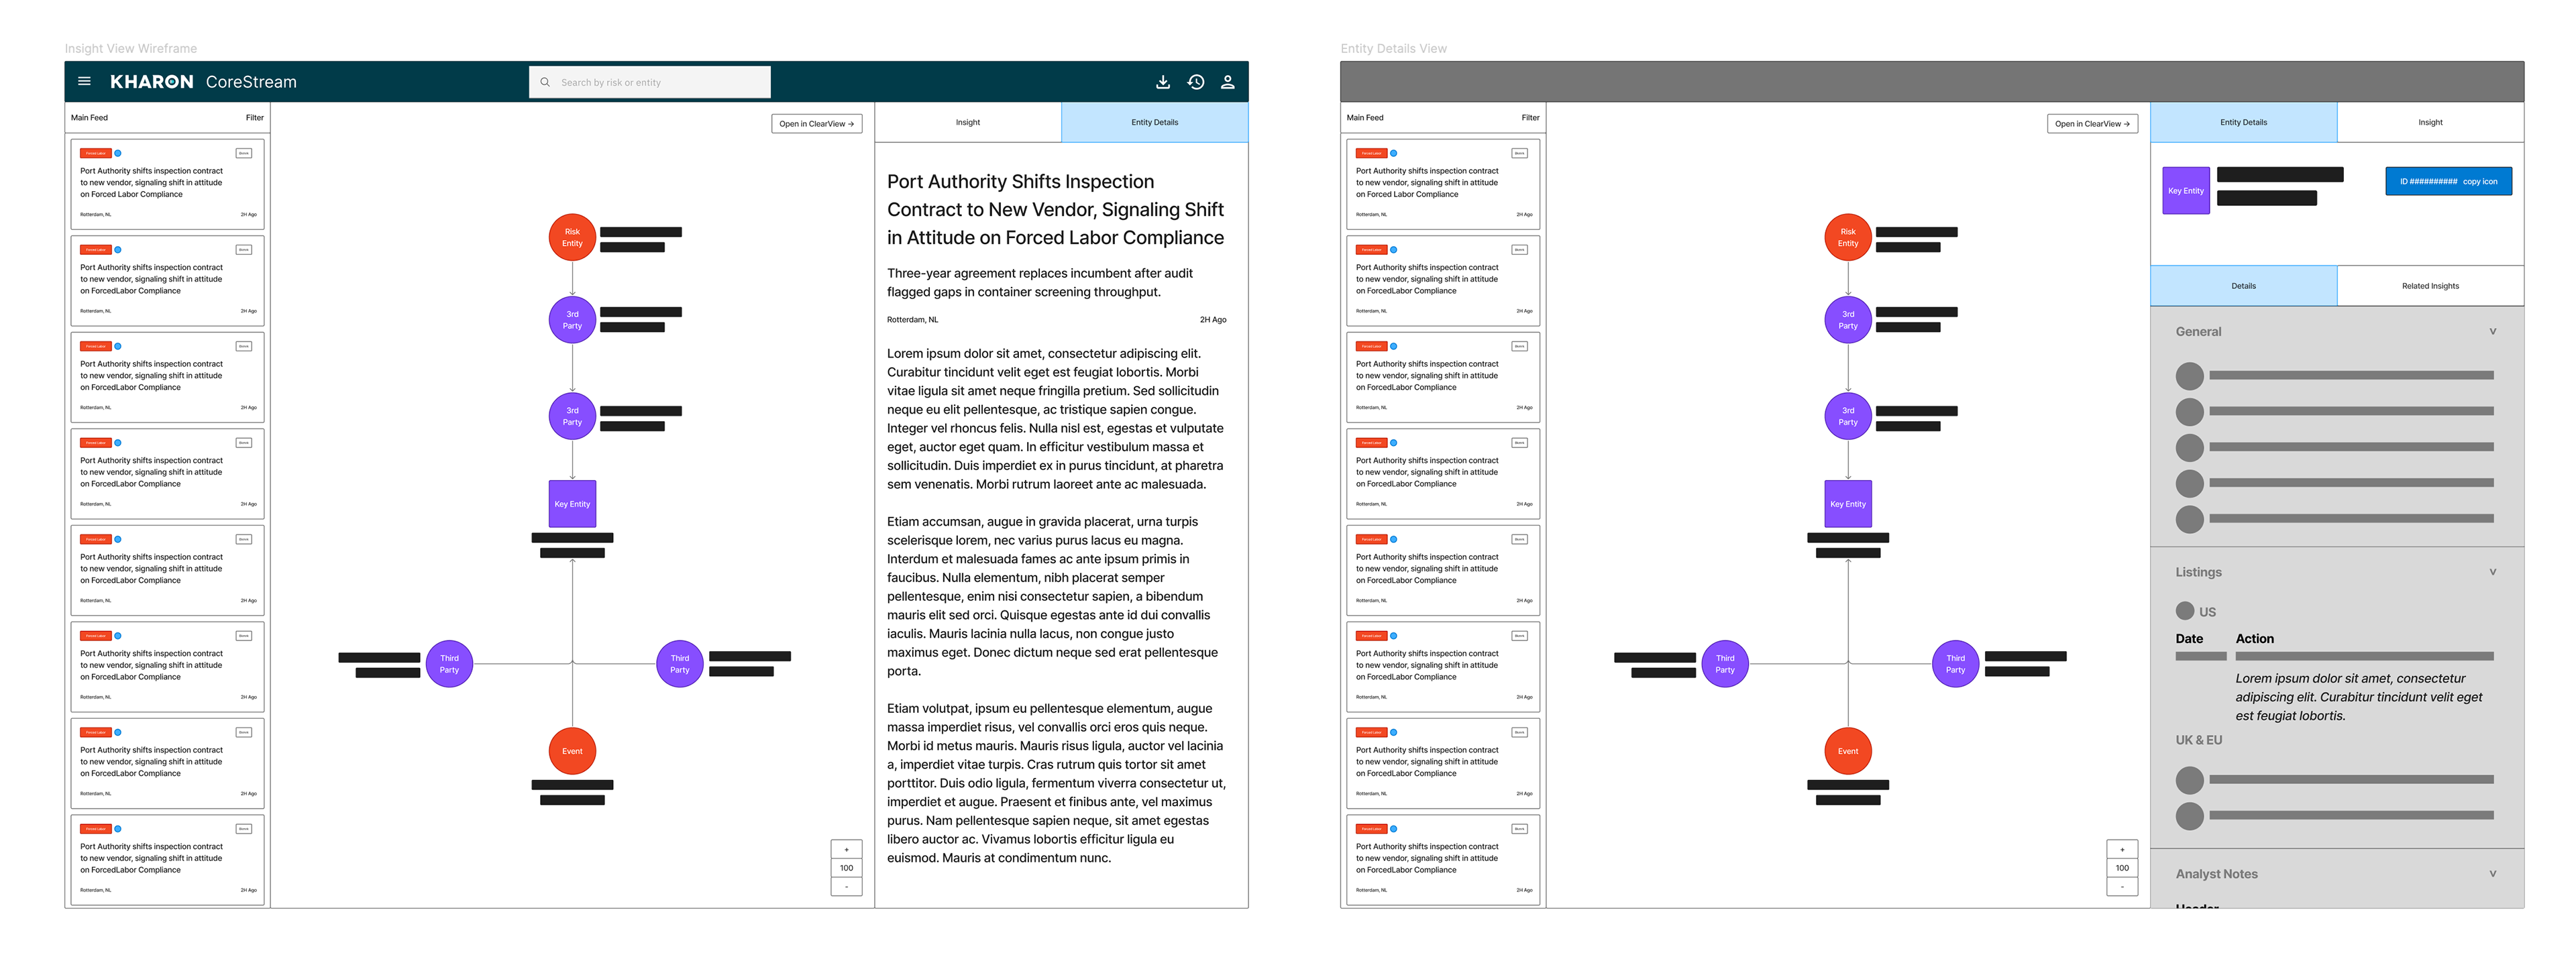
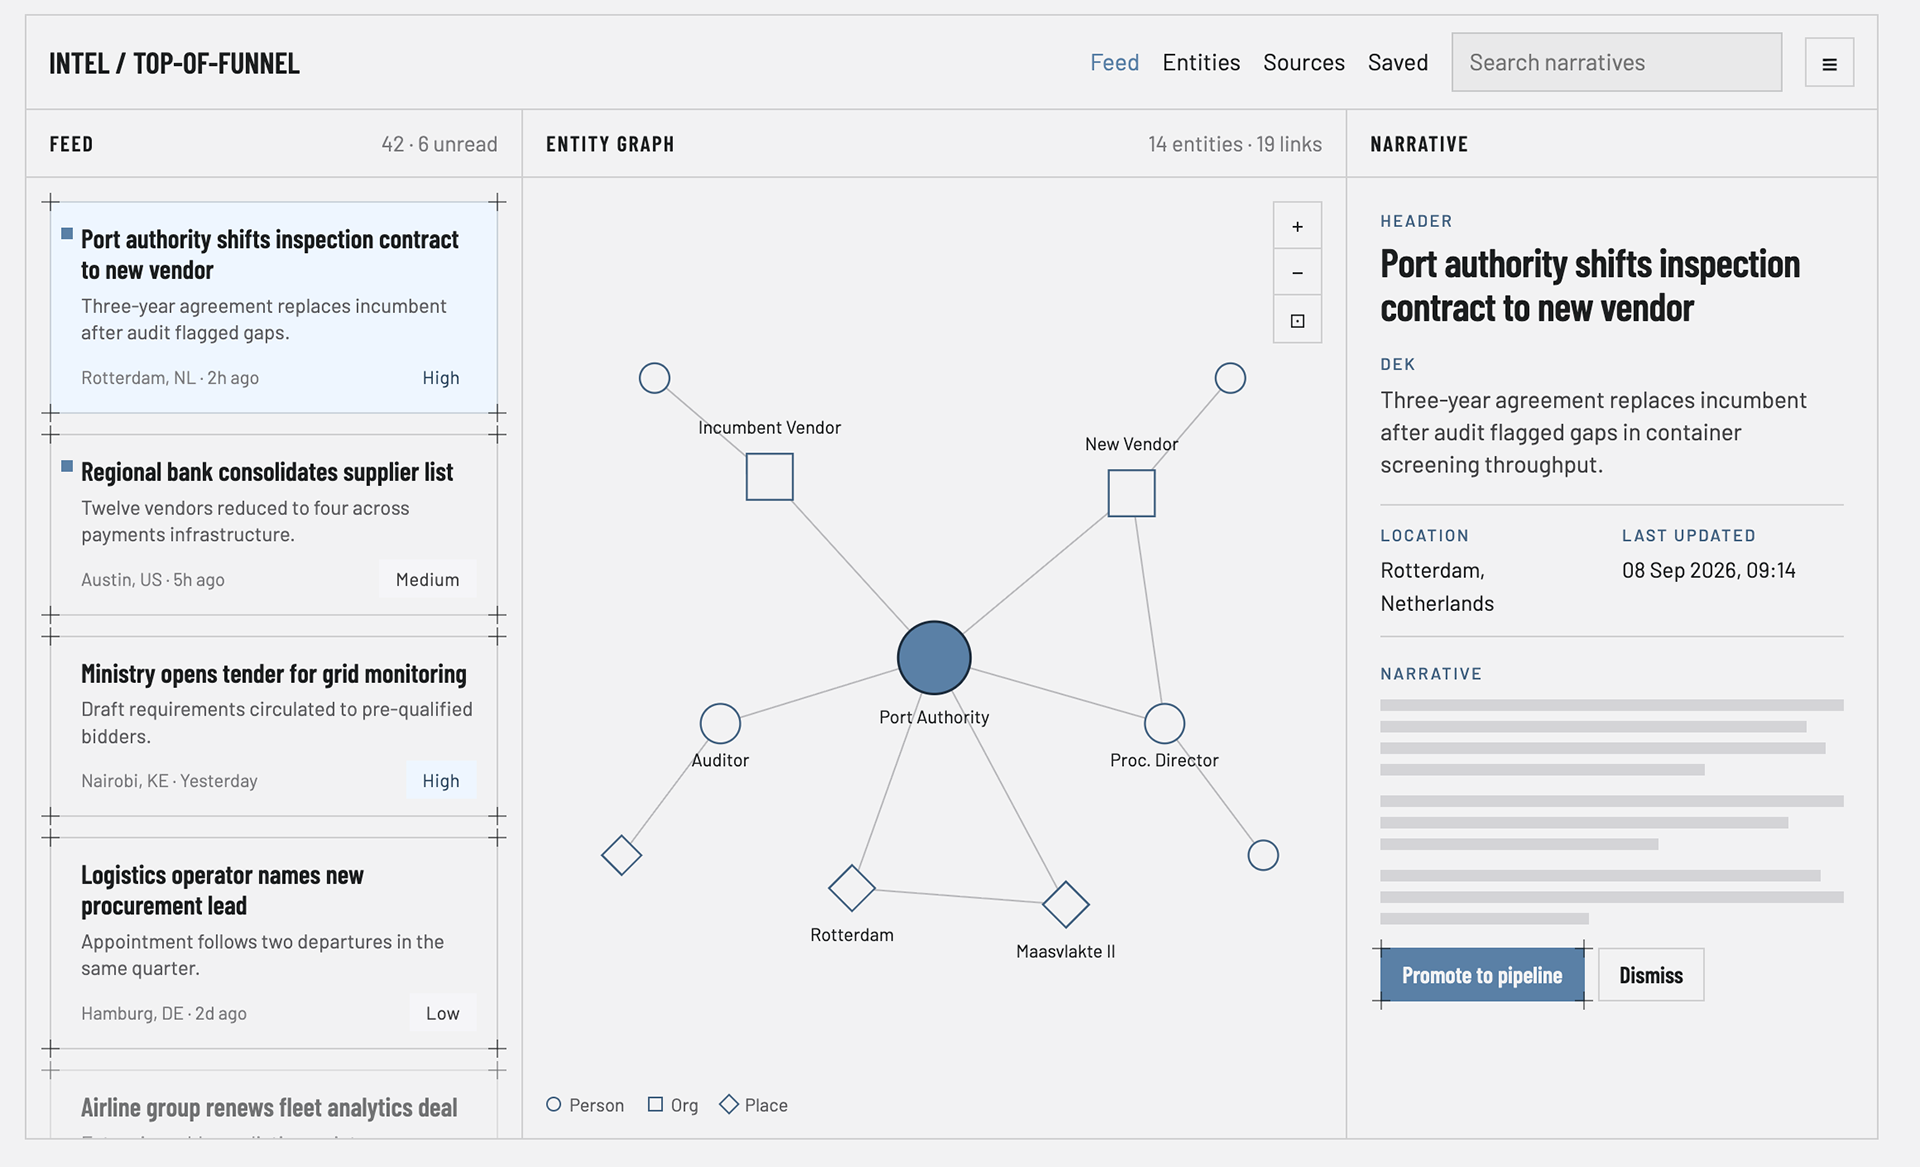
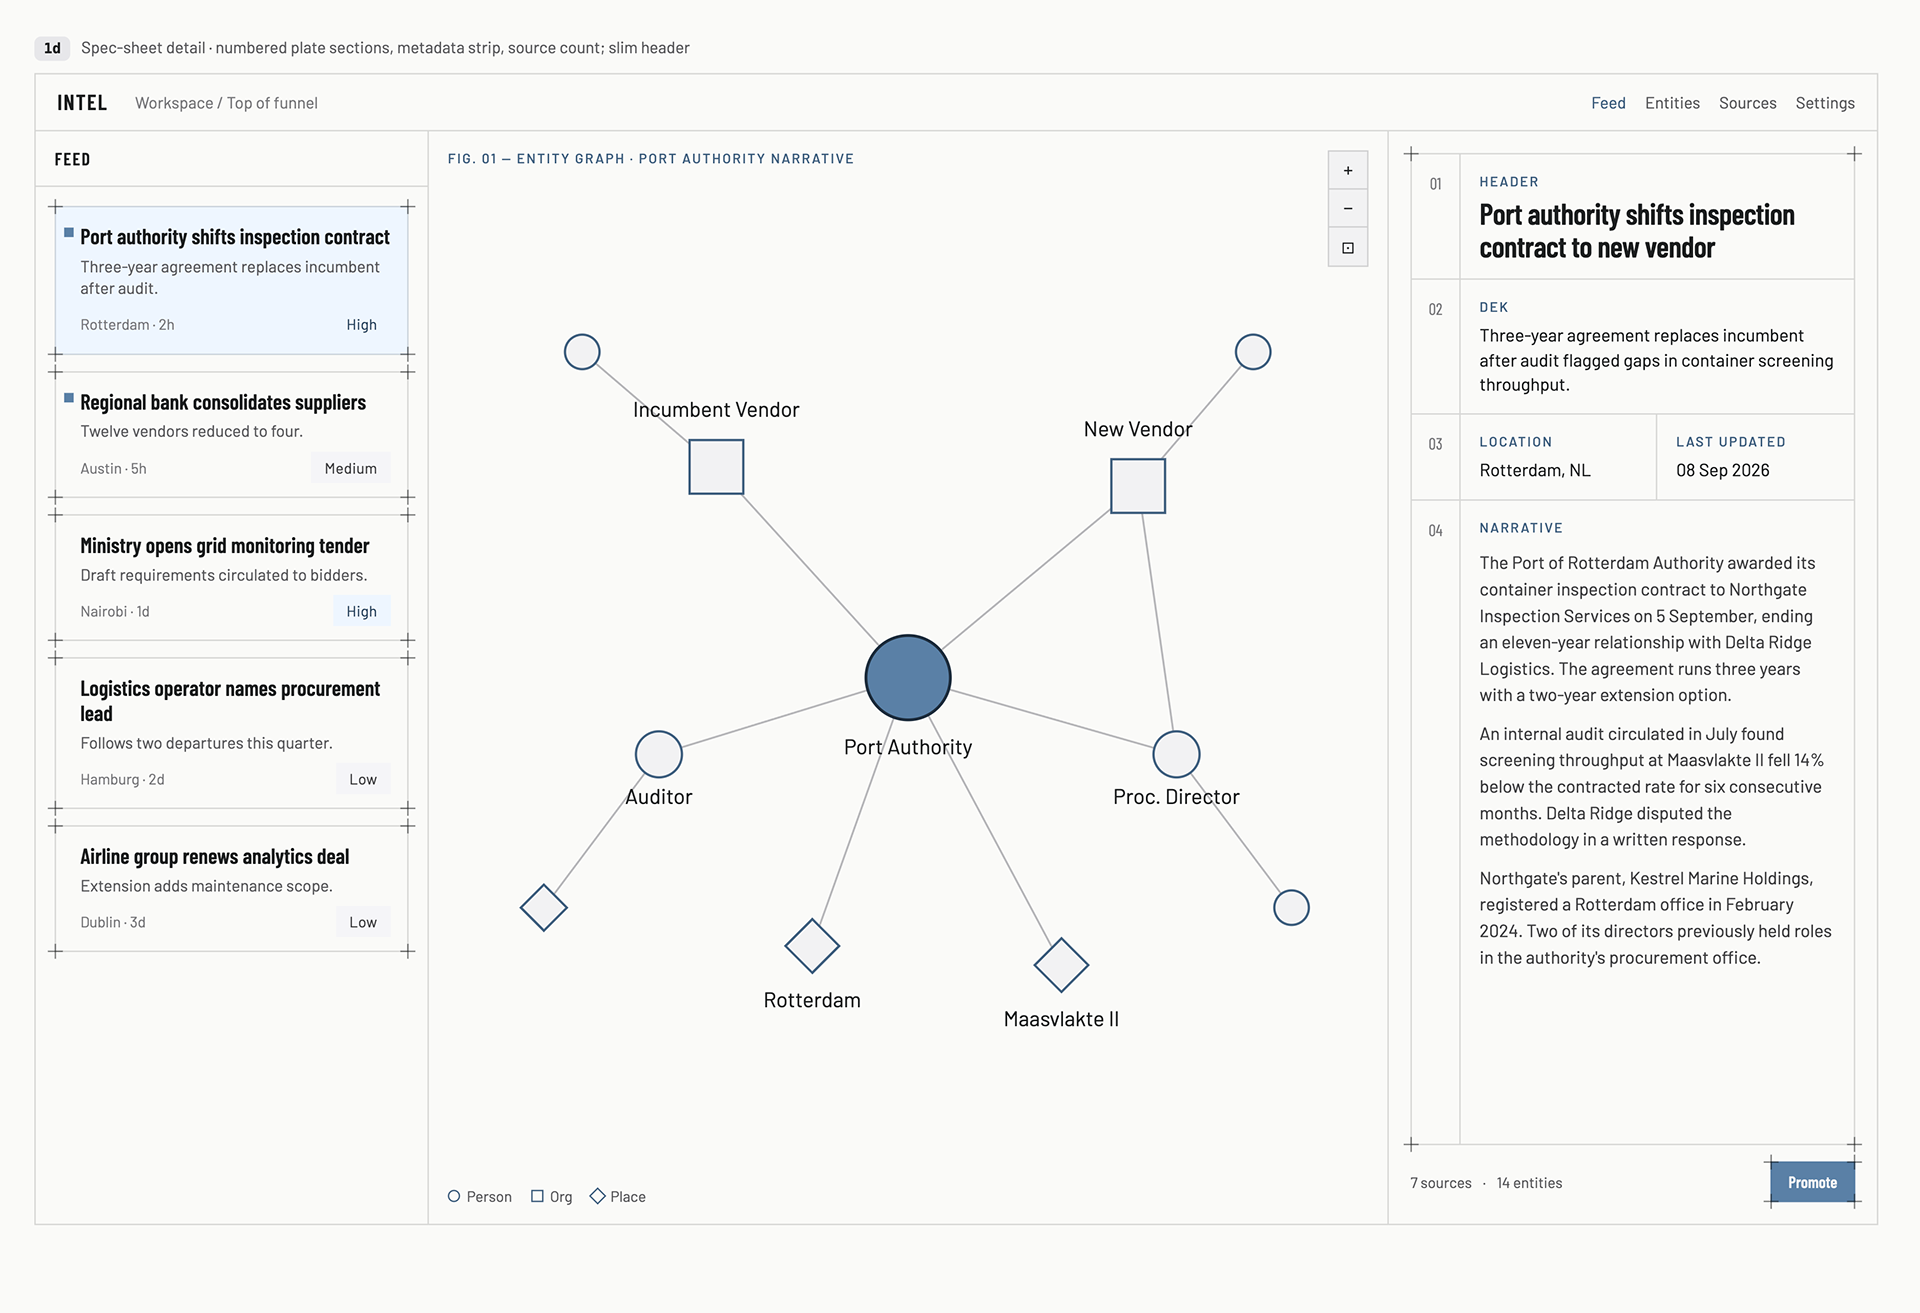
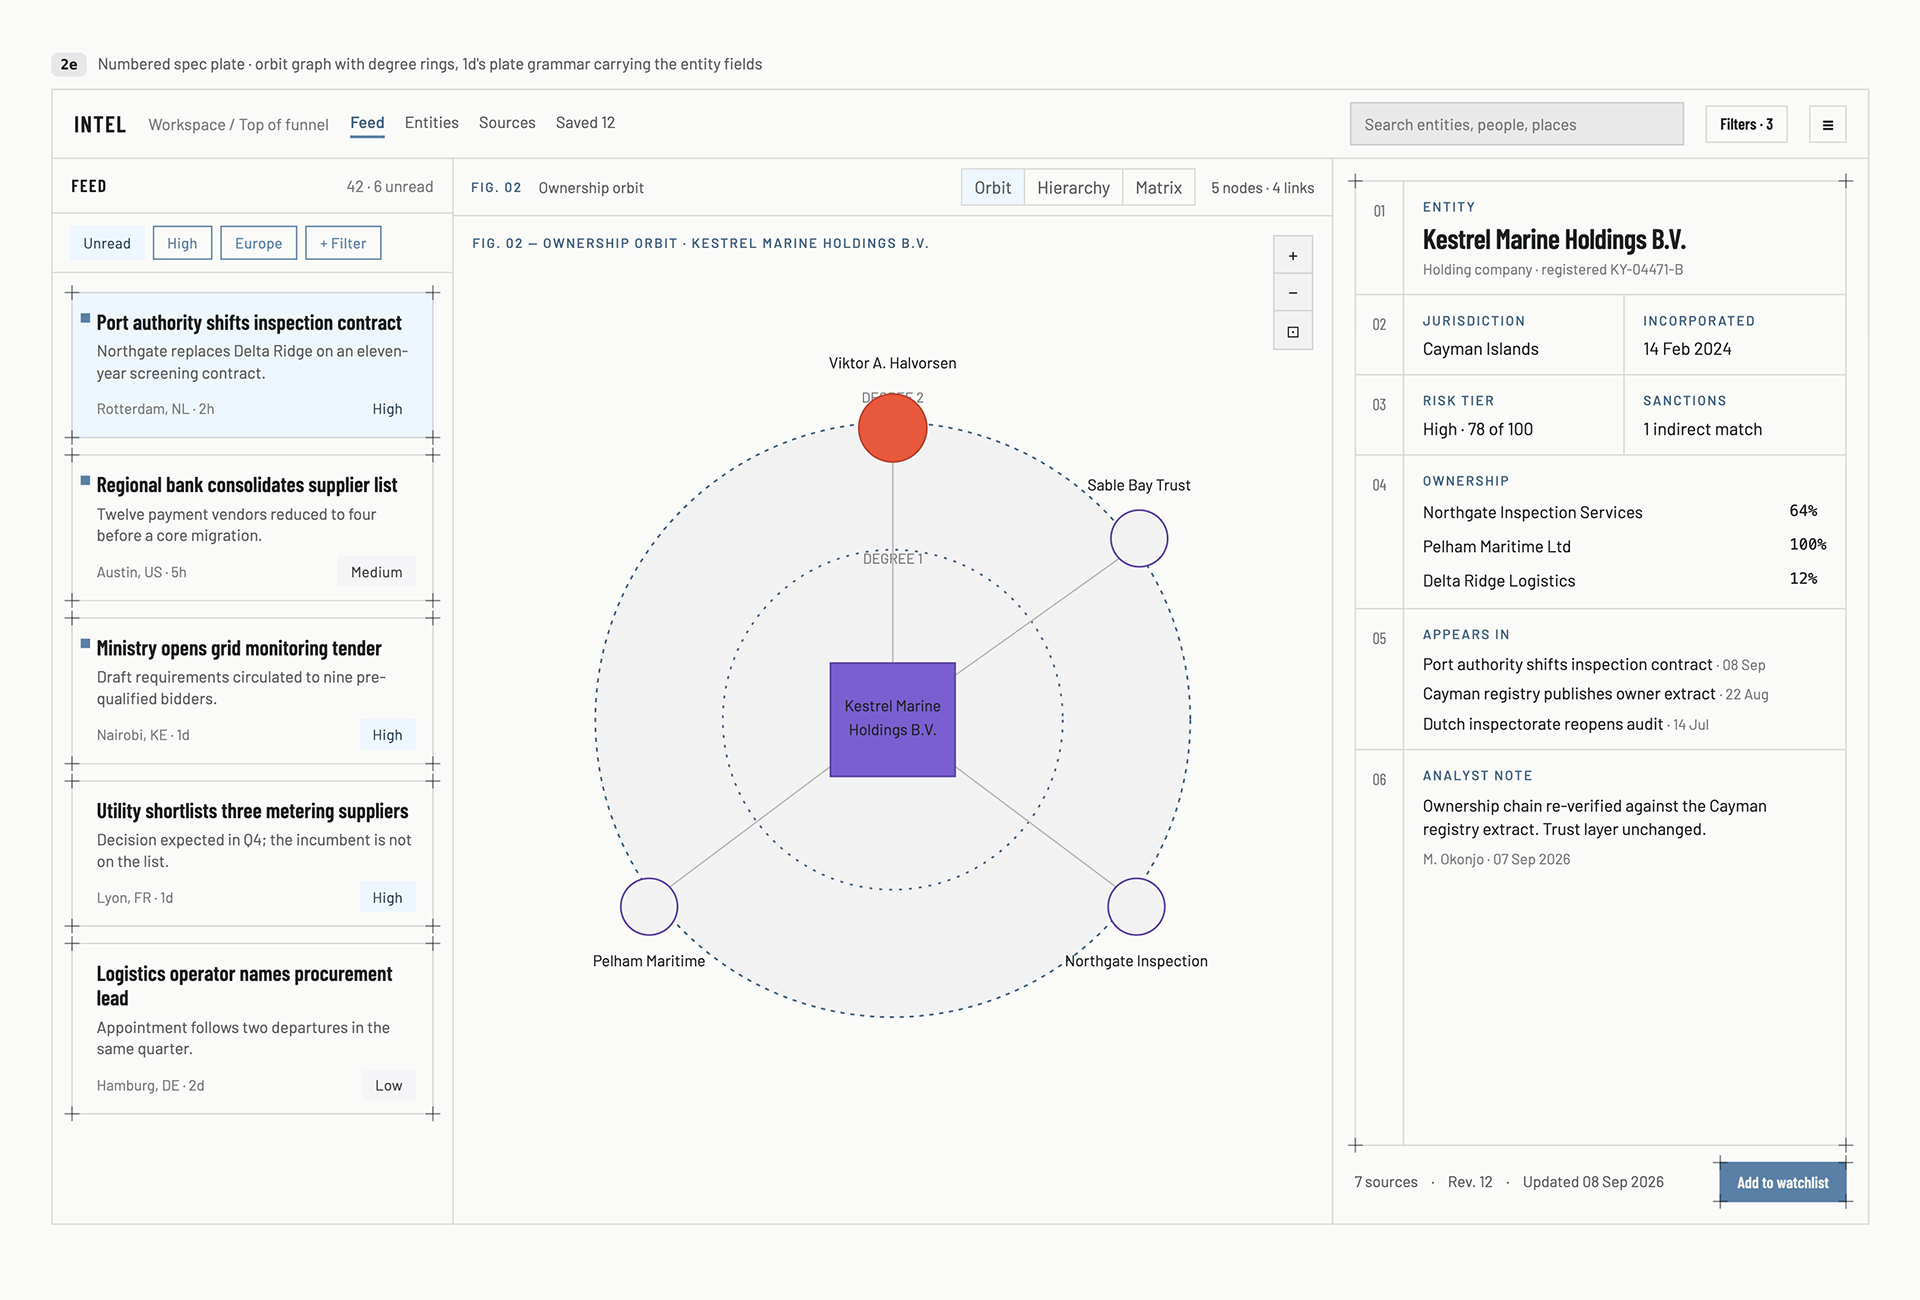
We had to define an MVP experience to work towards. So we started with a classic 3-column approach. Tiles on the left, mapping in the middle, narratives on the right. Because we were using Claude Code and Claude Design, we were able to skip many of the low-fidelity and low-quality mockups and ideas that often come with beginning a project from scratch.
Phases Over One-Shots
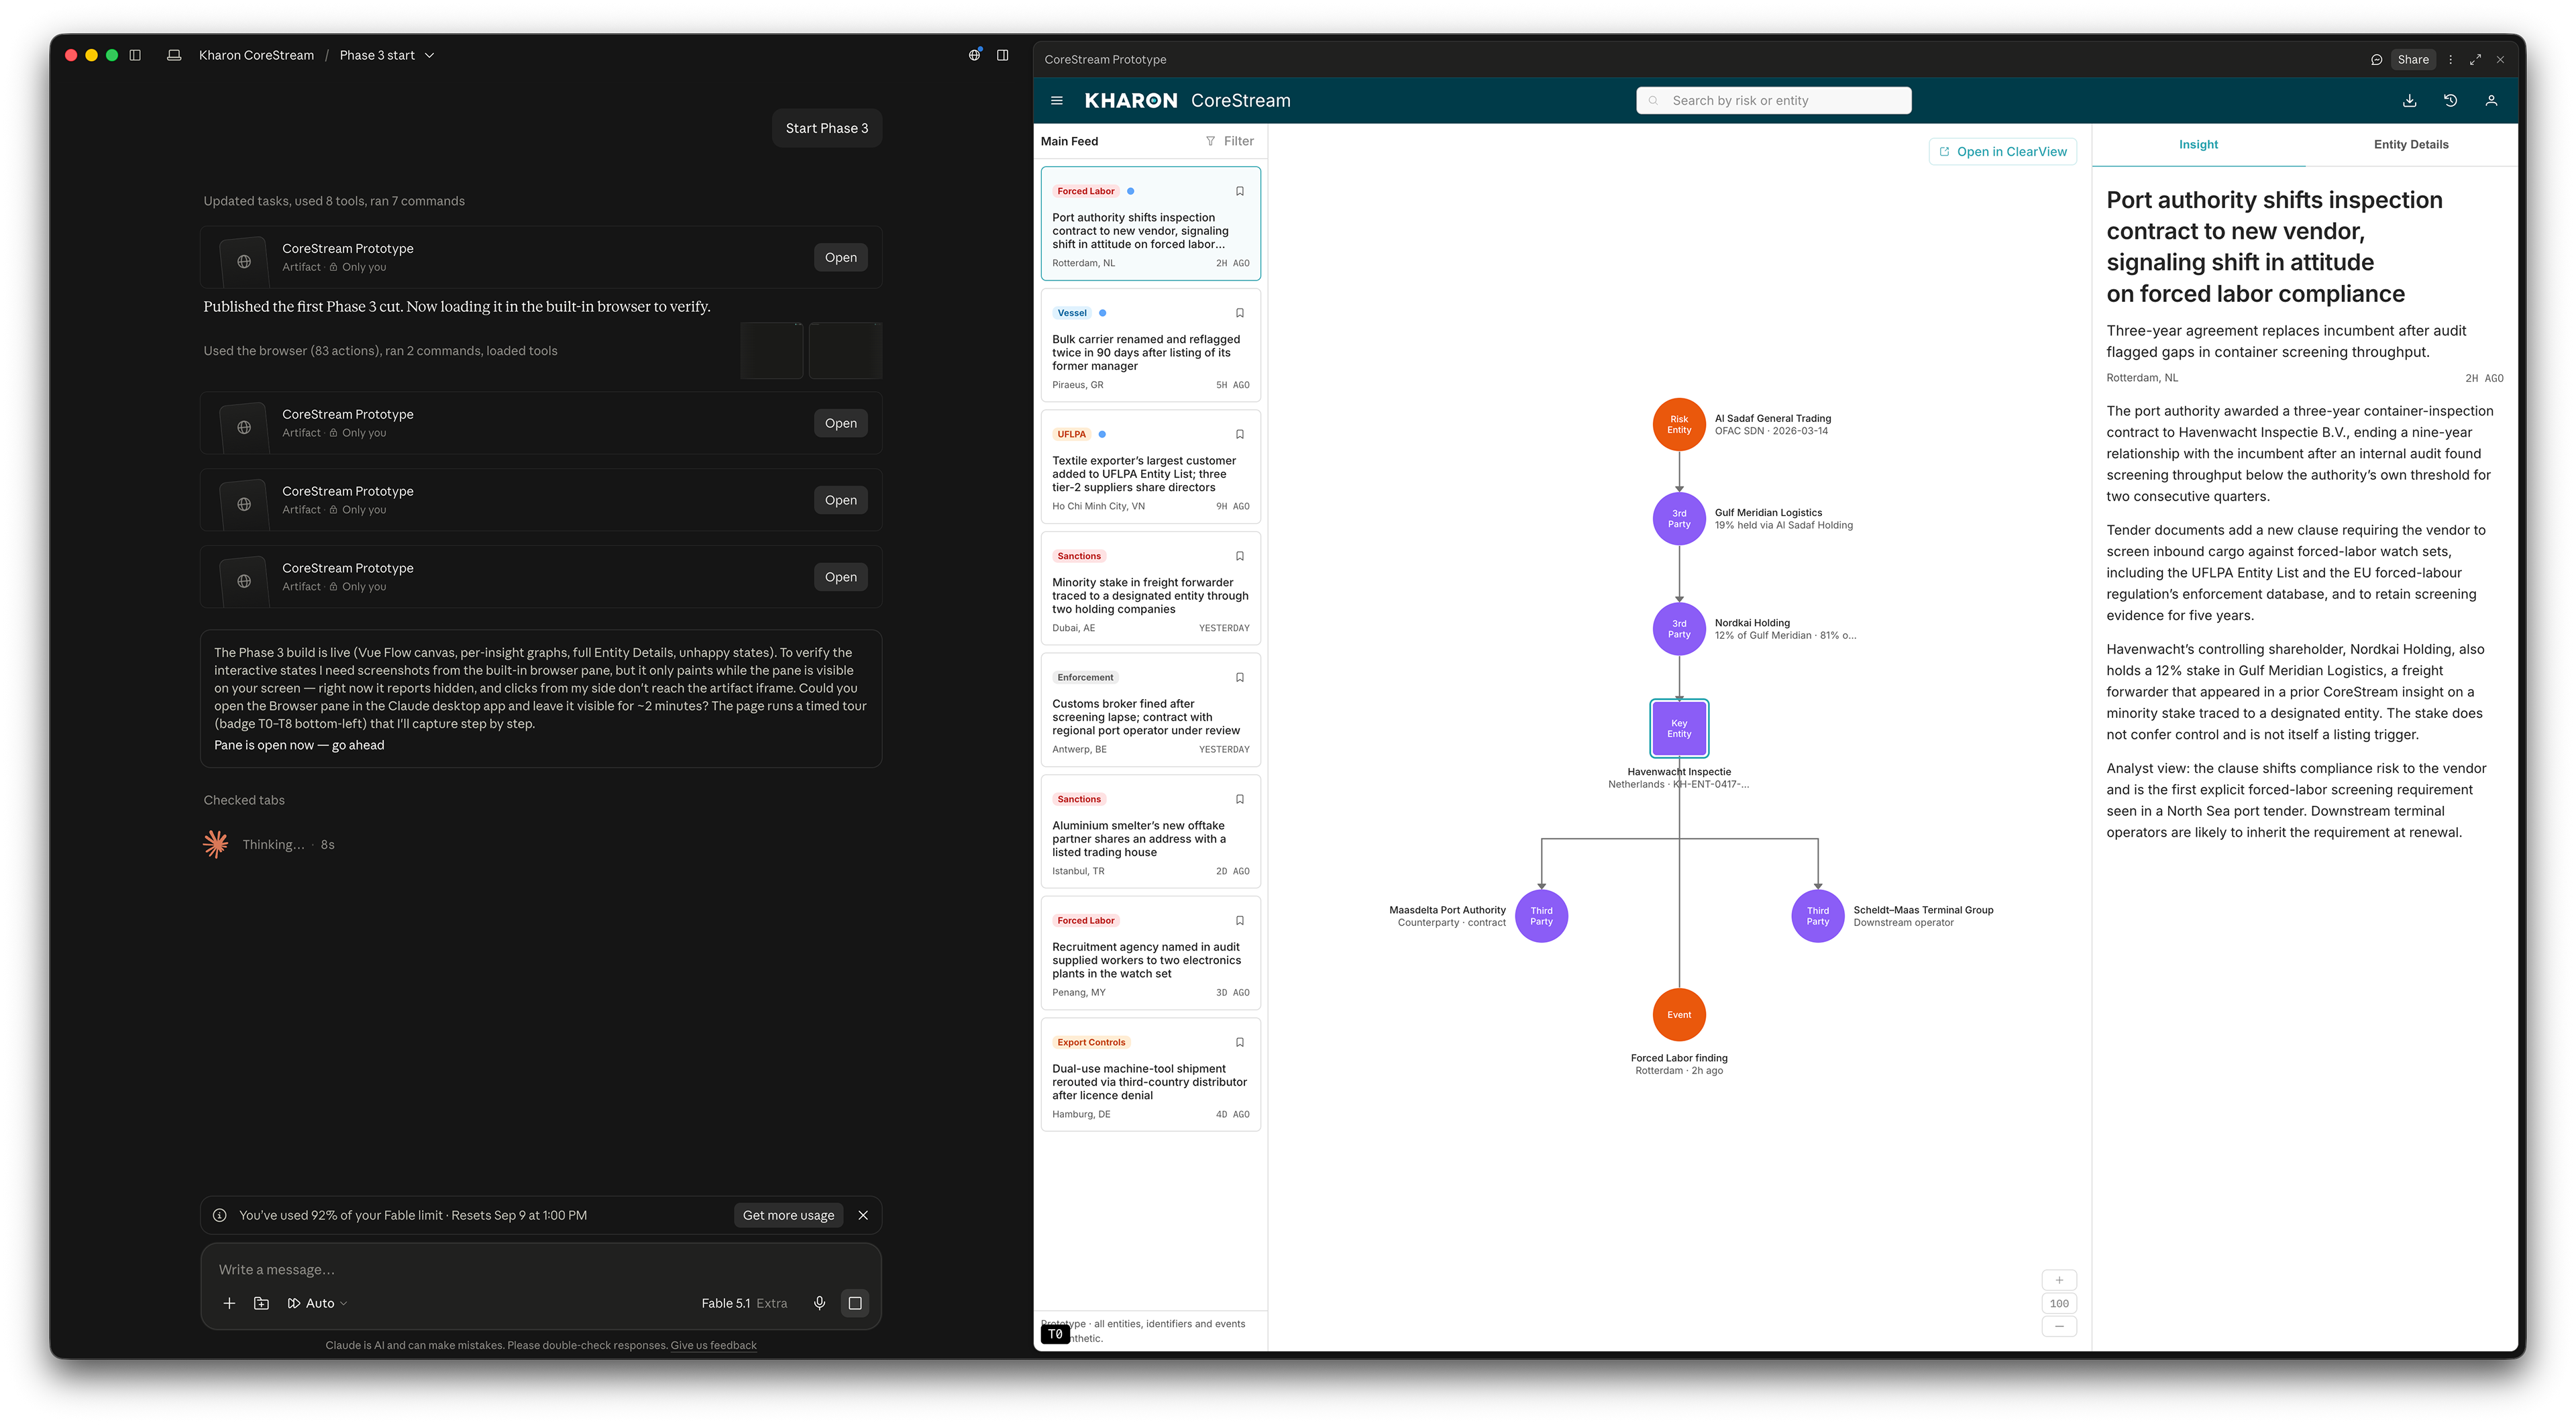
One-shots are awesome, when we get them right, we feel like we can do anything. But in the complex world of UX, they can rarely be relied upon. I broke my interactive wireframing into phases using a mix of Matt's Skills and custom skills that I had produced in-house to match our branding, framework, and unique user profiles.
Feature Discovery
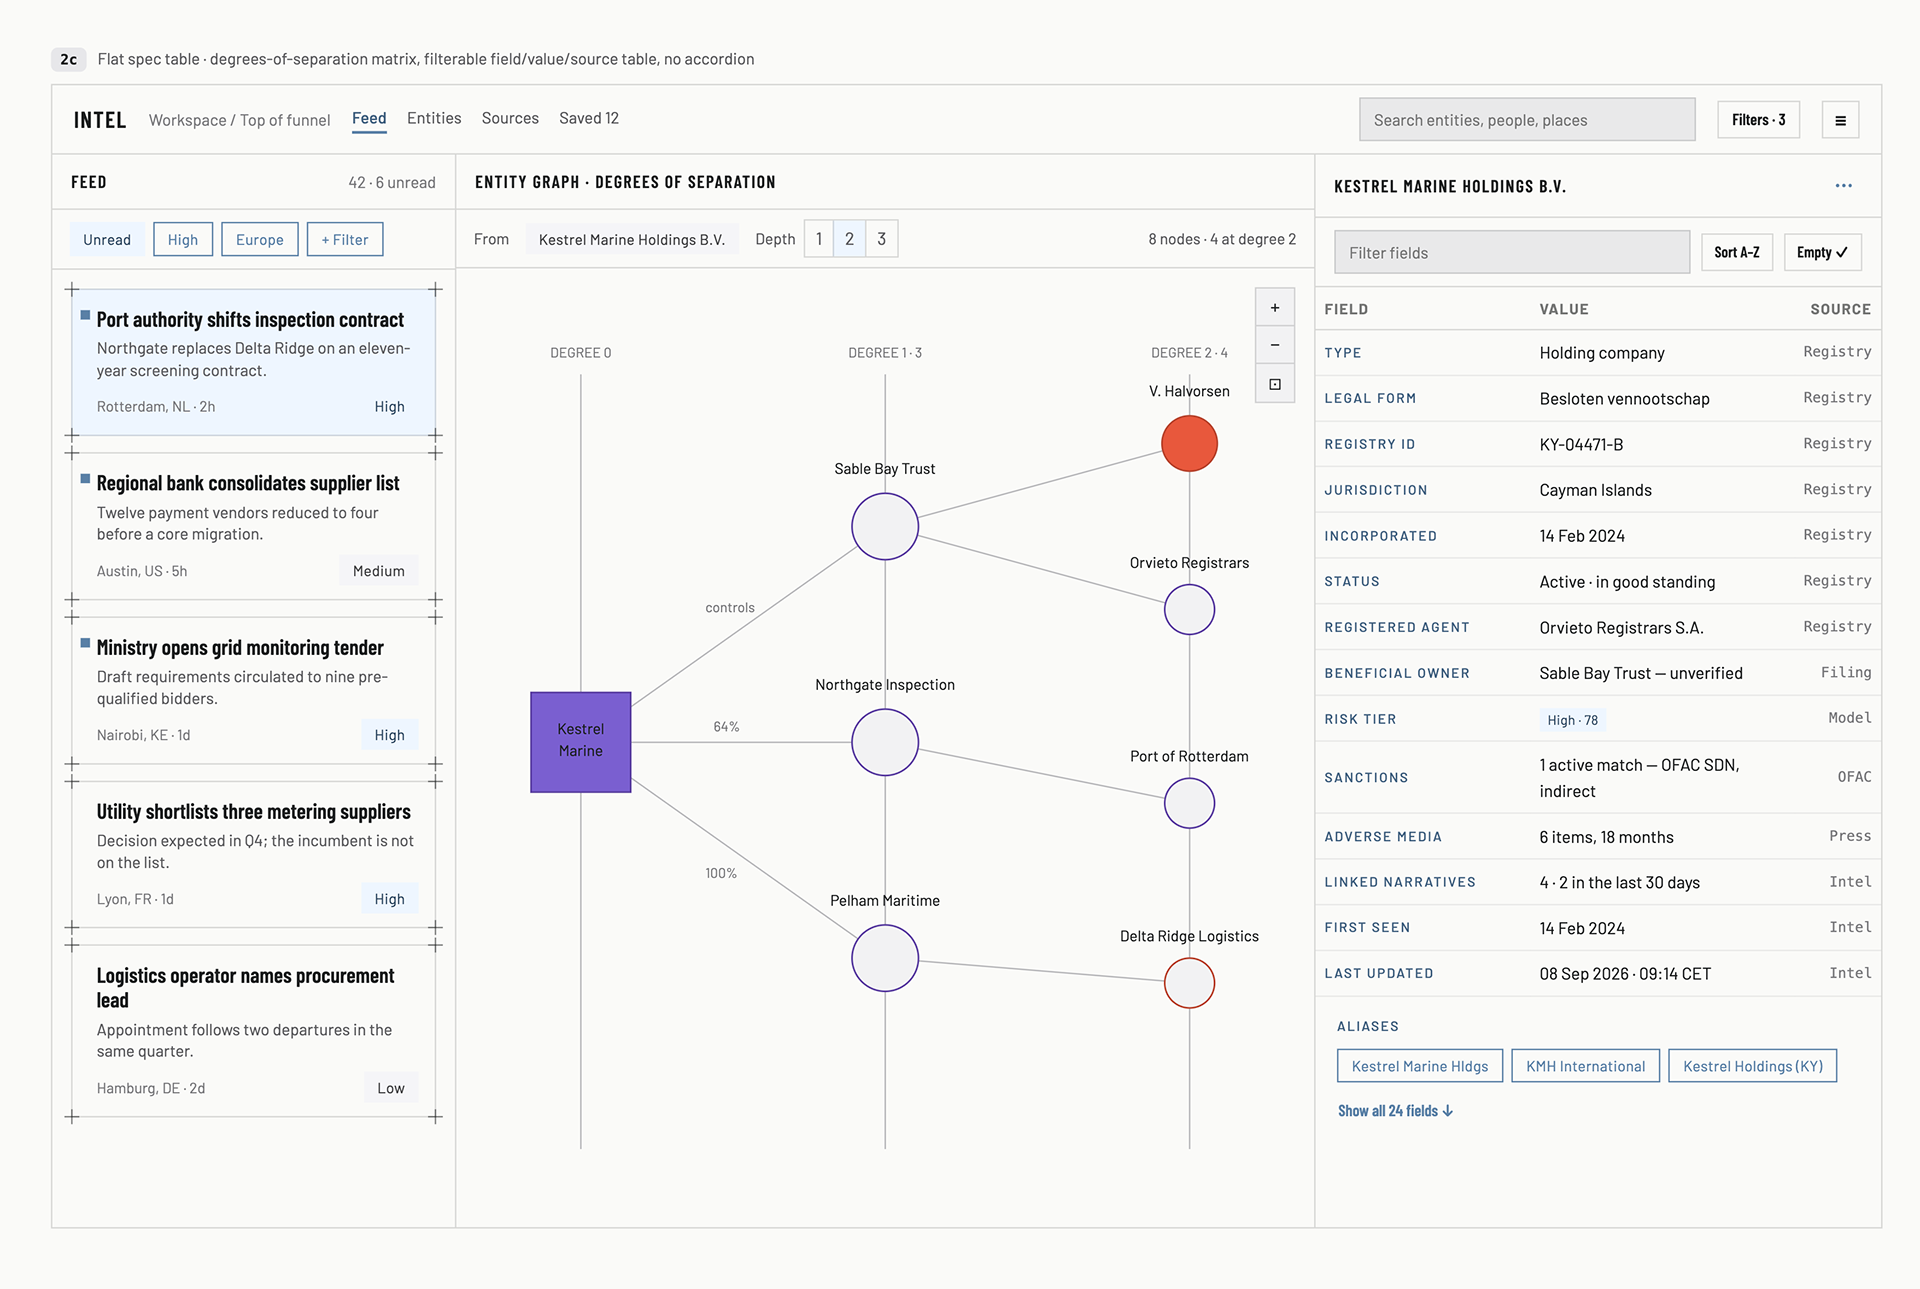
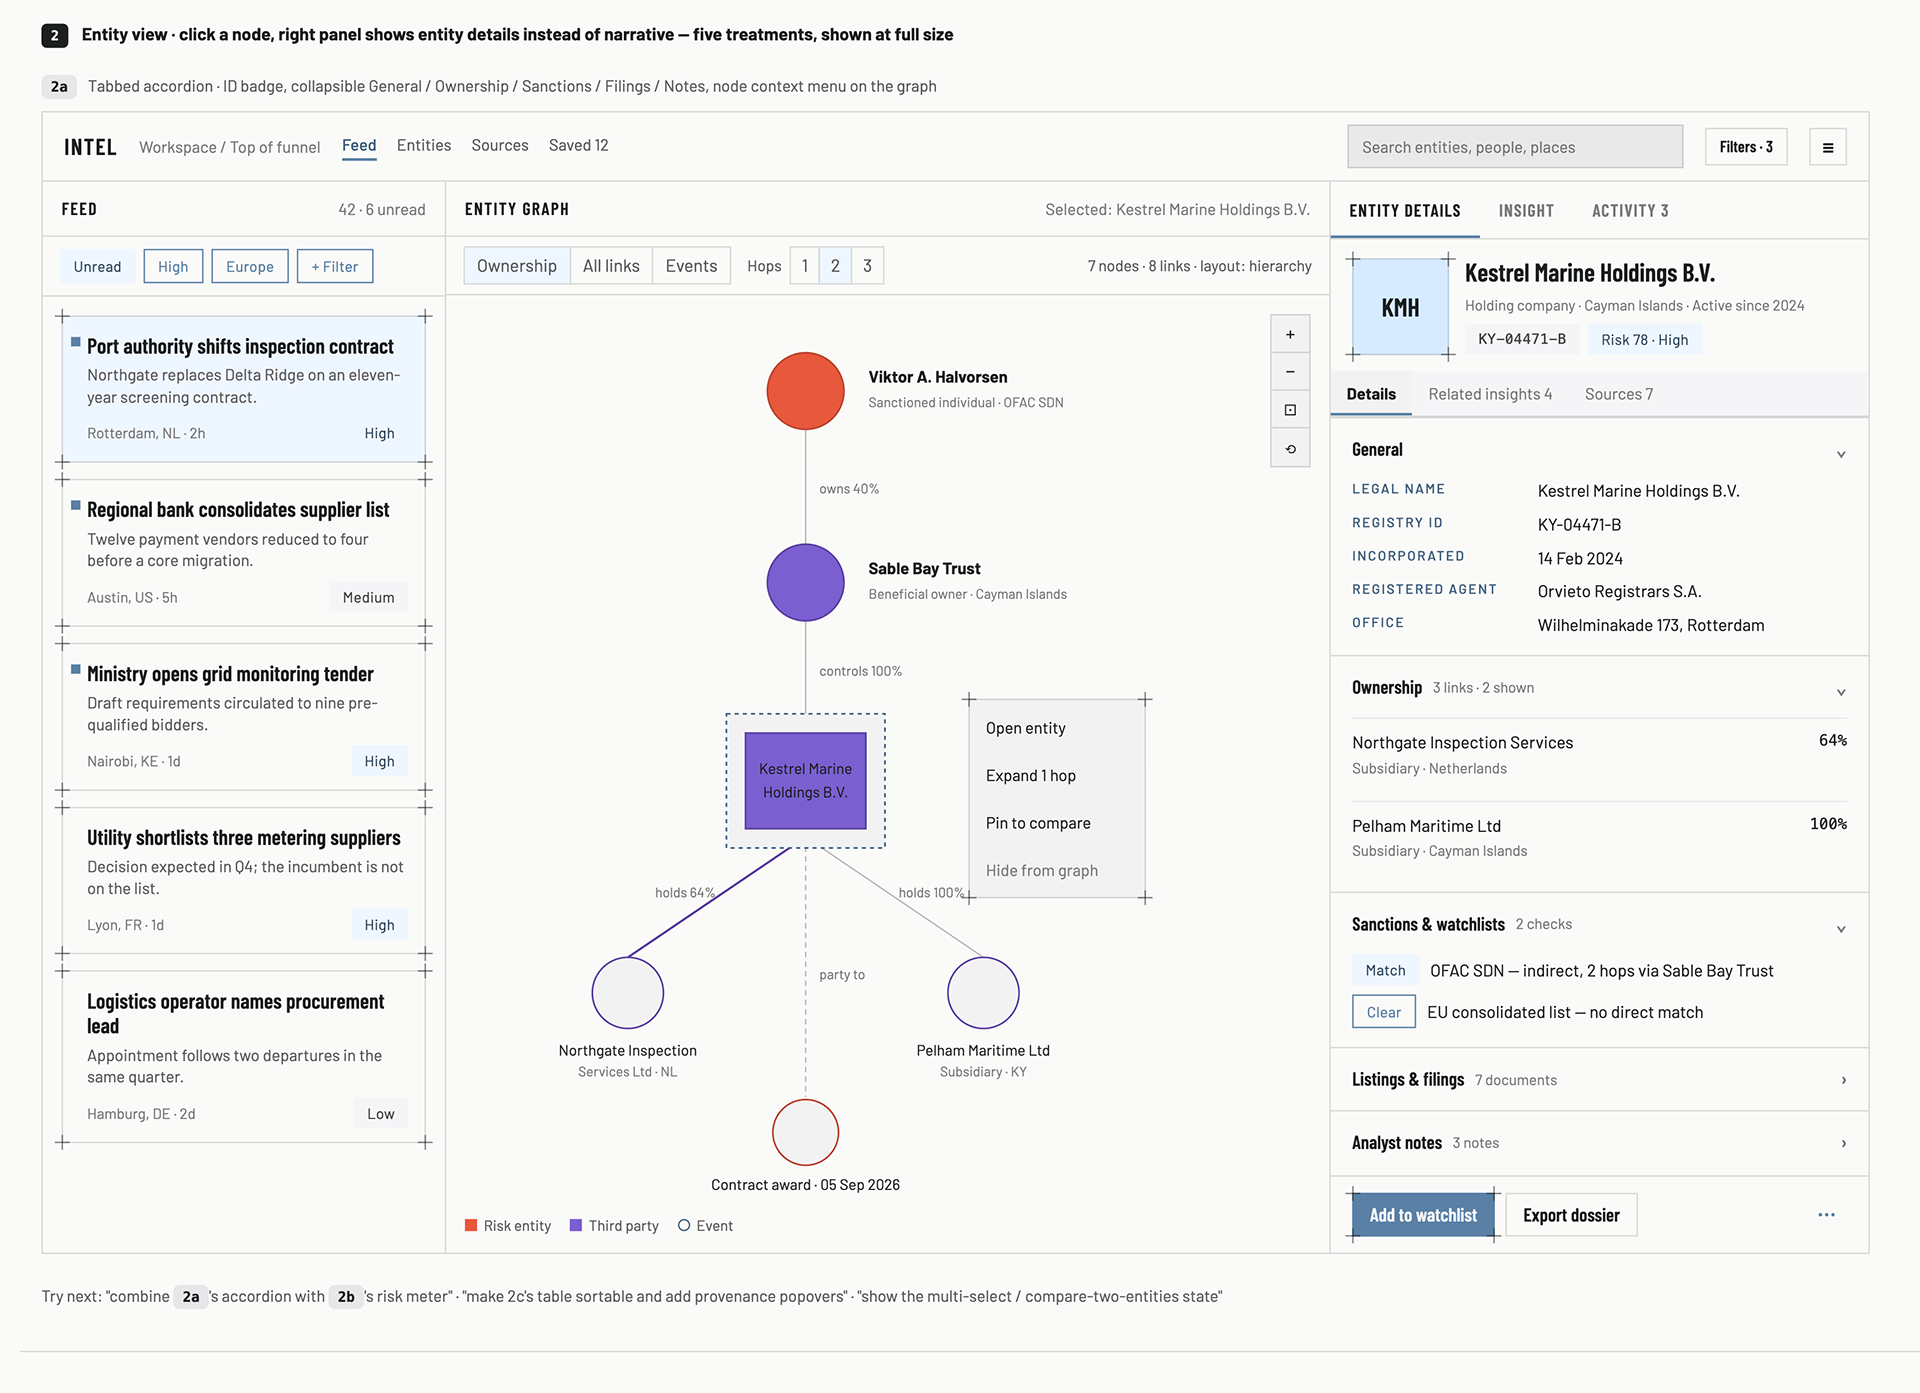
We outlined broad features early, and discovered how they were "shaped" along the way. Filters gained greater and greater utility and clarity as we tested our prototypes both in-house and with our customers.
Design Systems
The system was based on PrimeVue, with Tailwind as a backup layer for any missing components or styles...
Troubleshooting the Agents
When working with agents, you never really know exactly what kind of hallucination you are going to get...
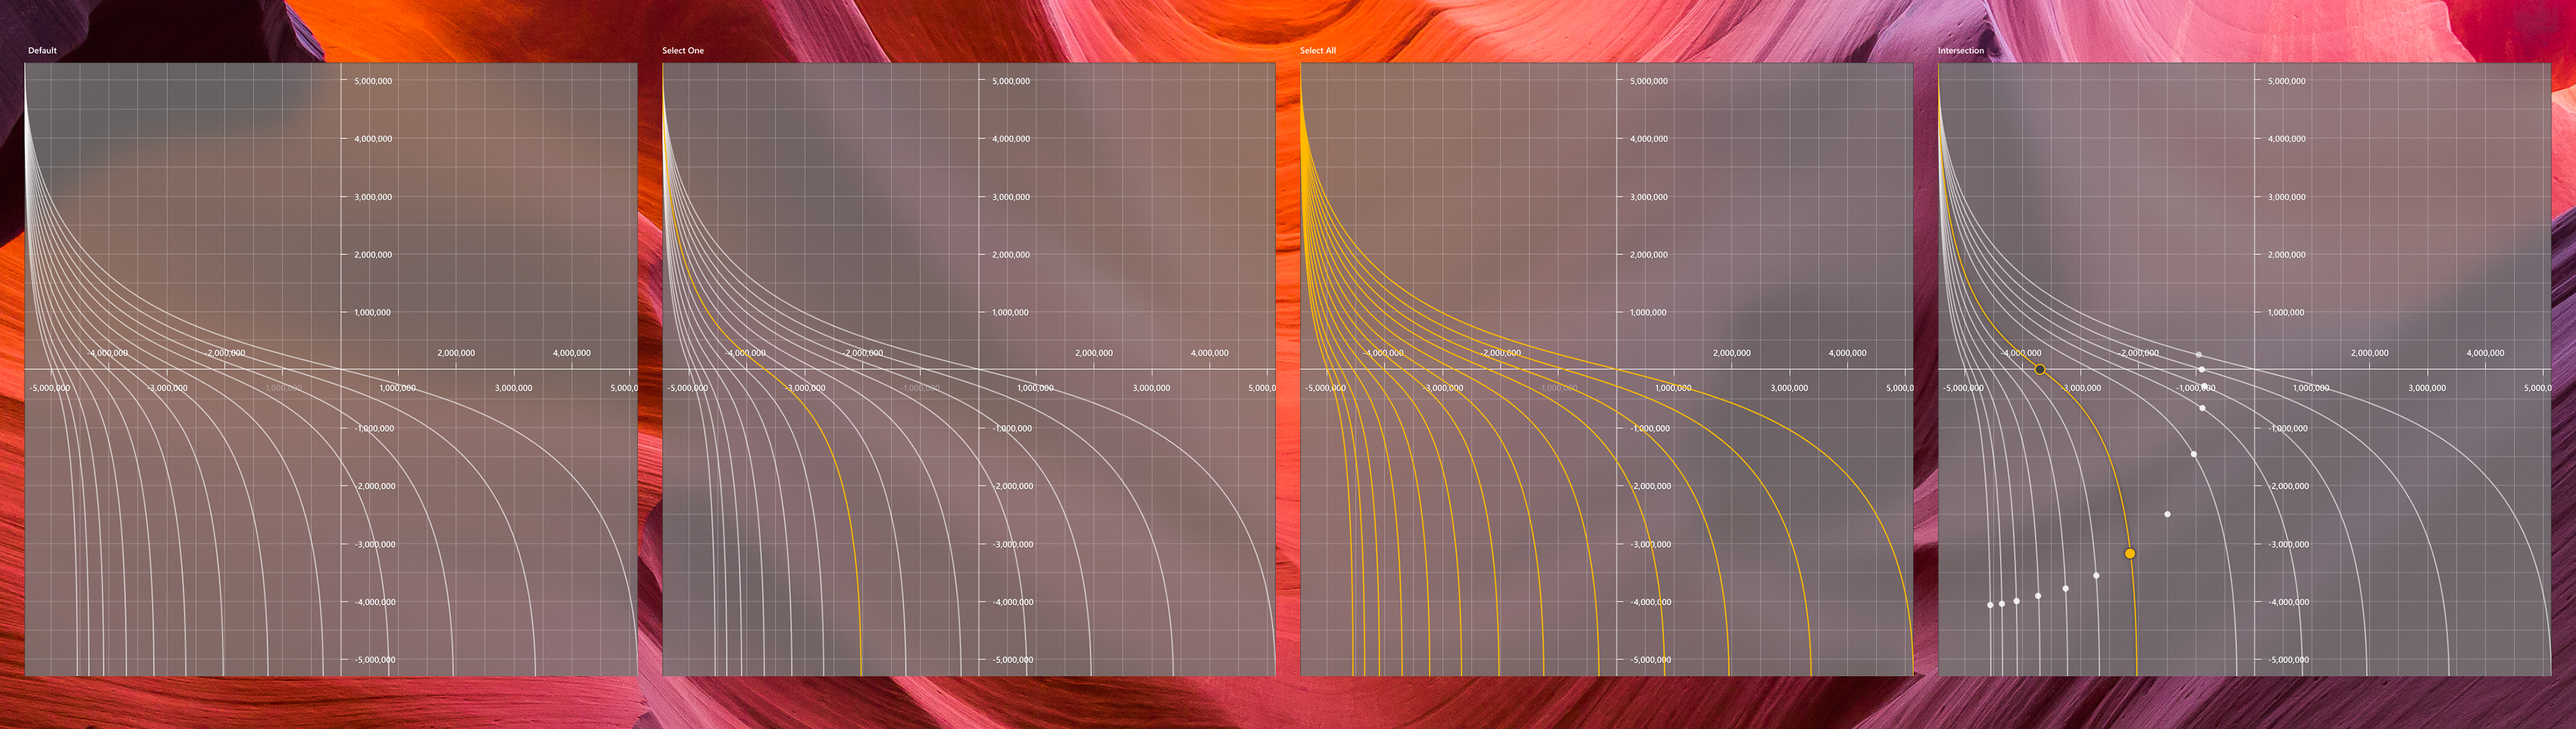
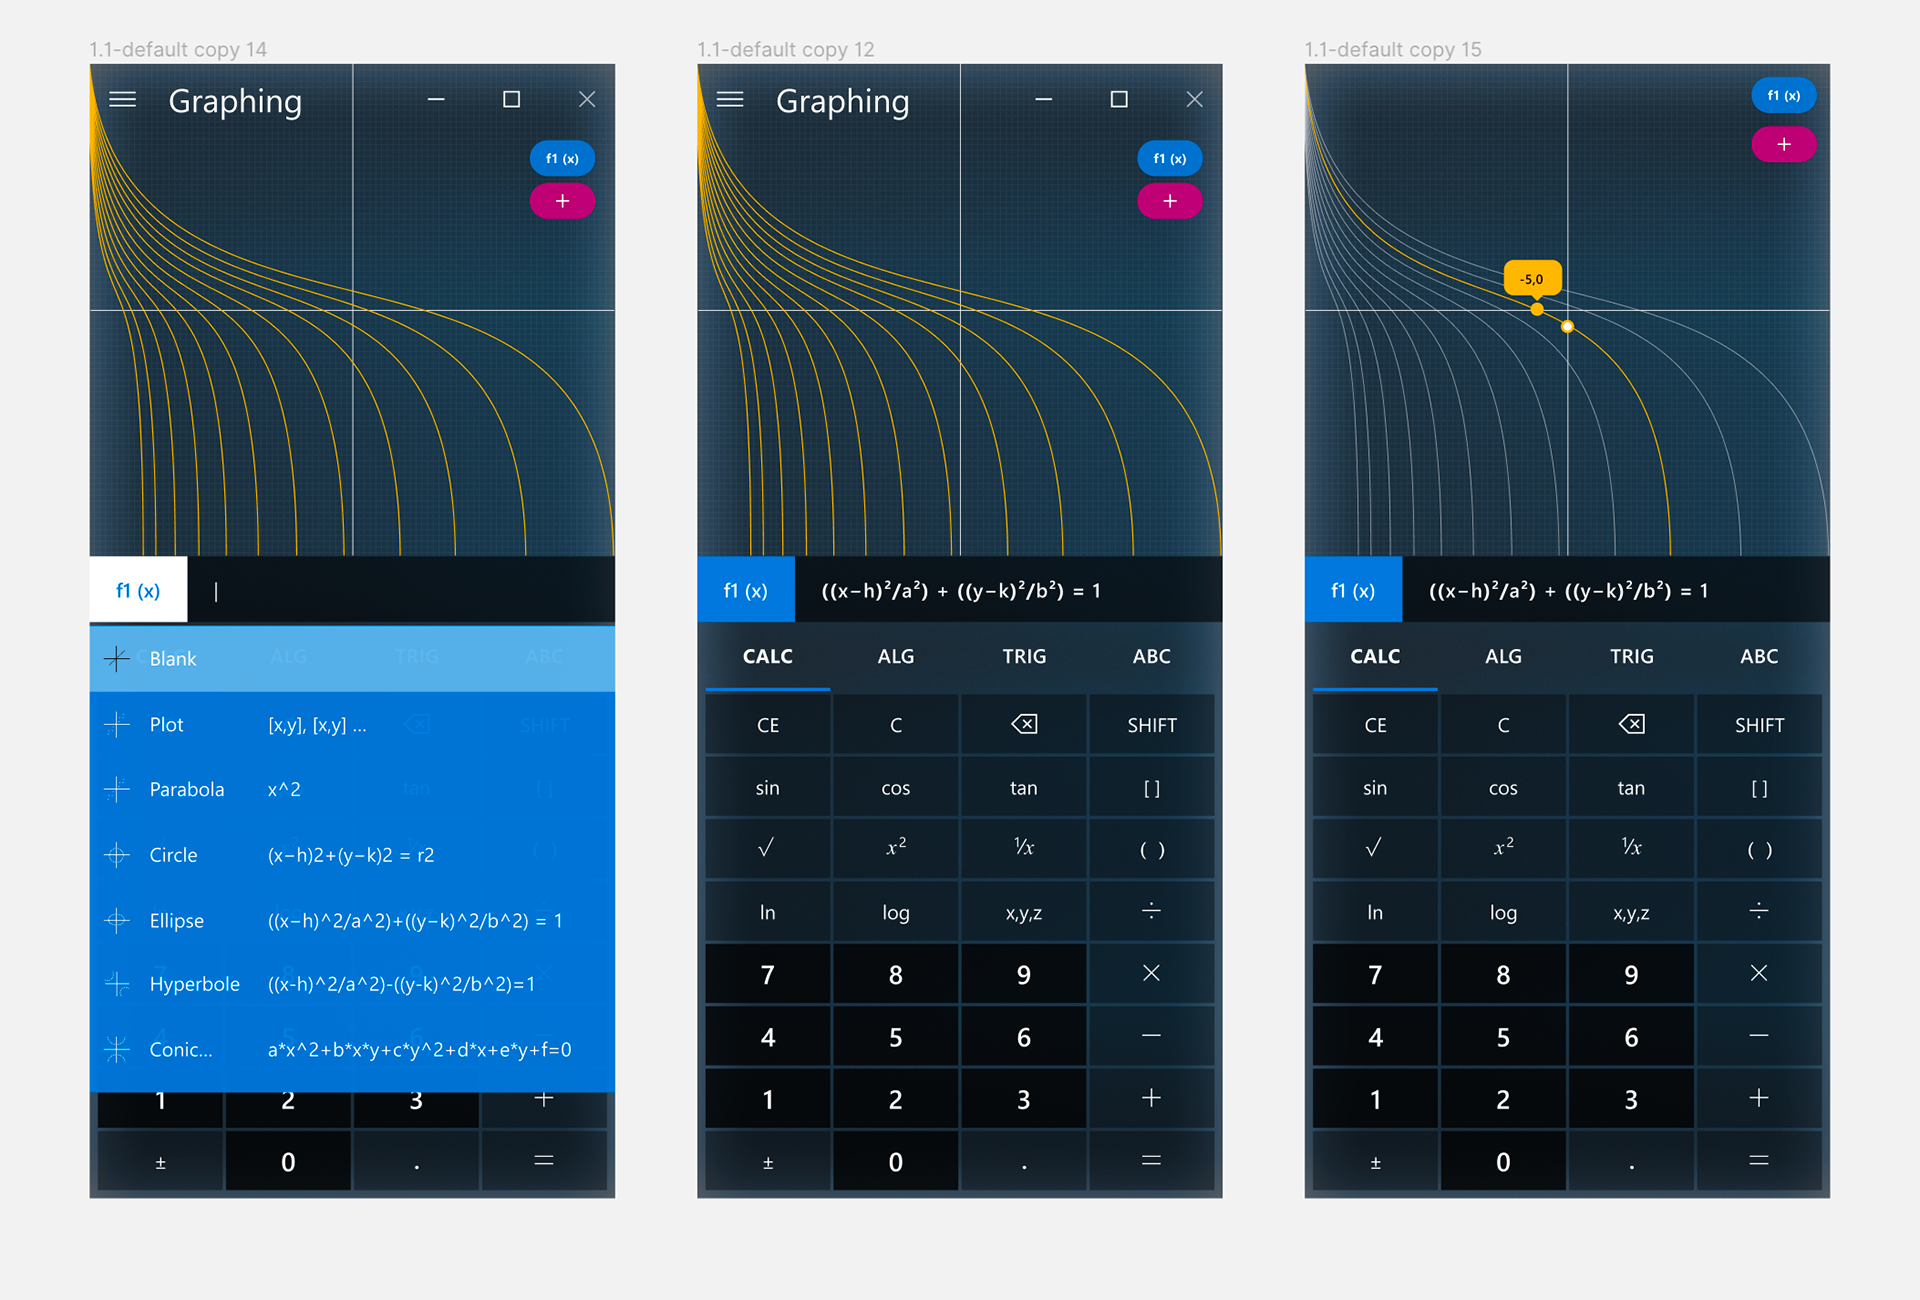
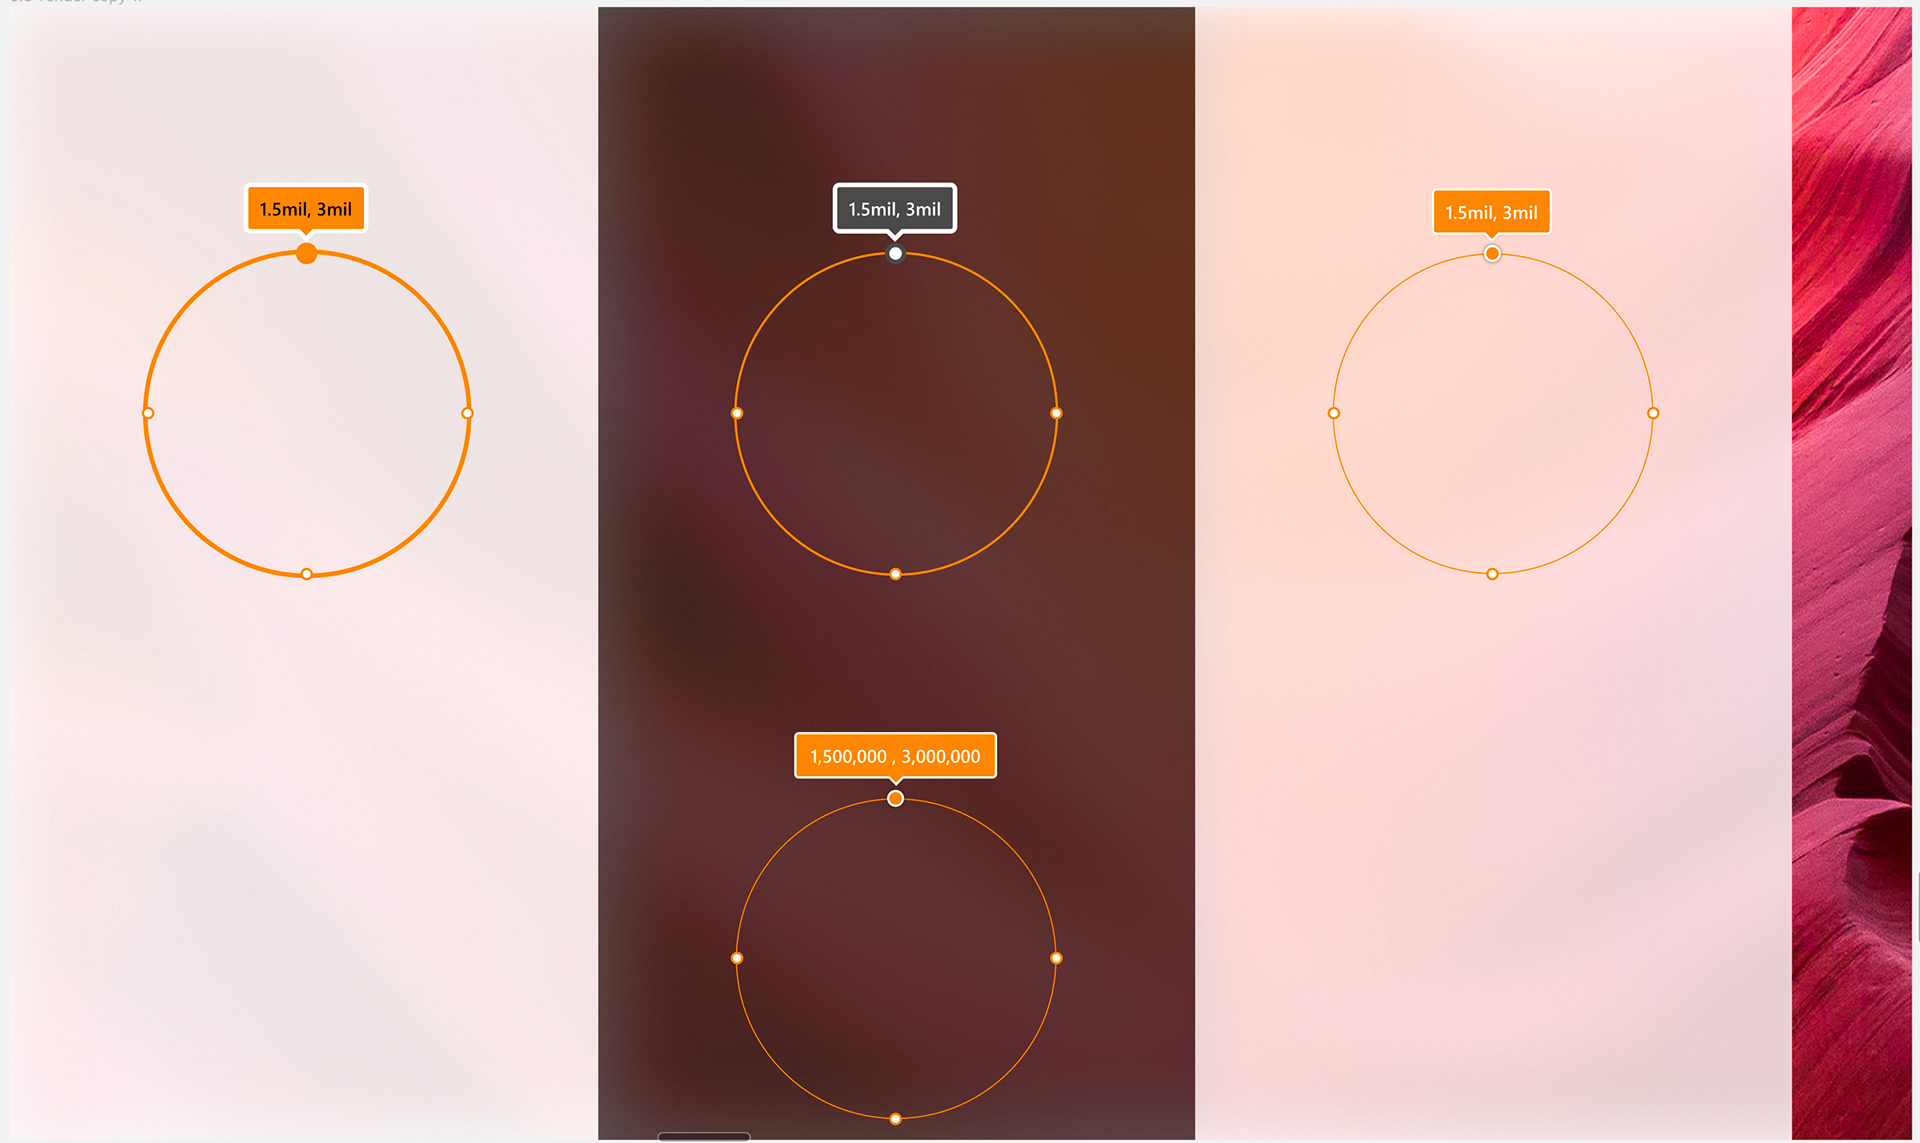
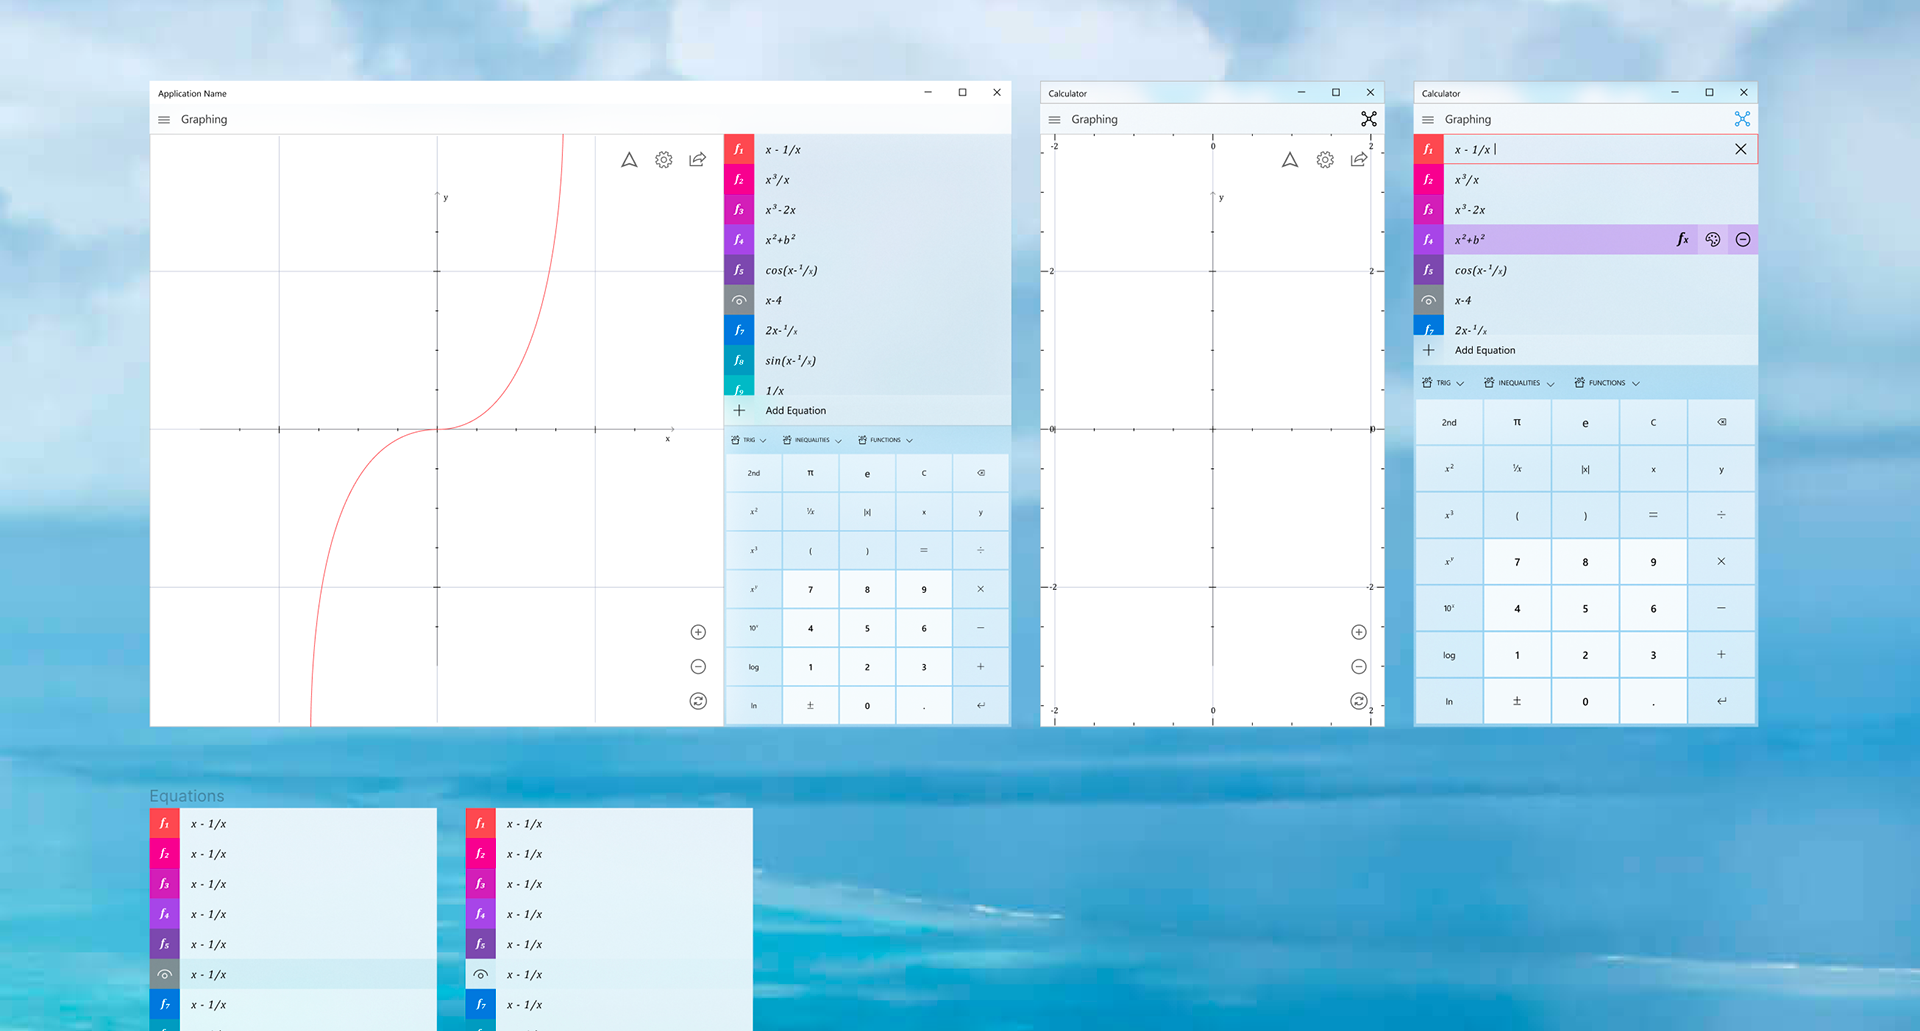
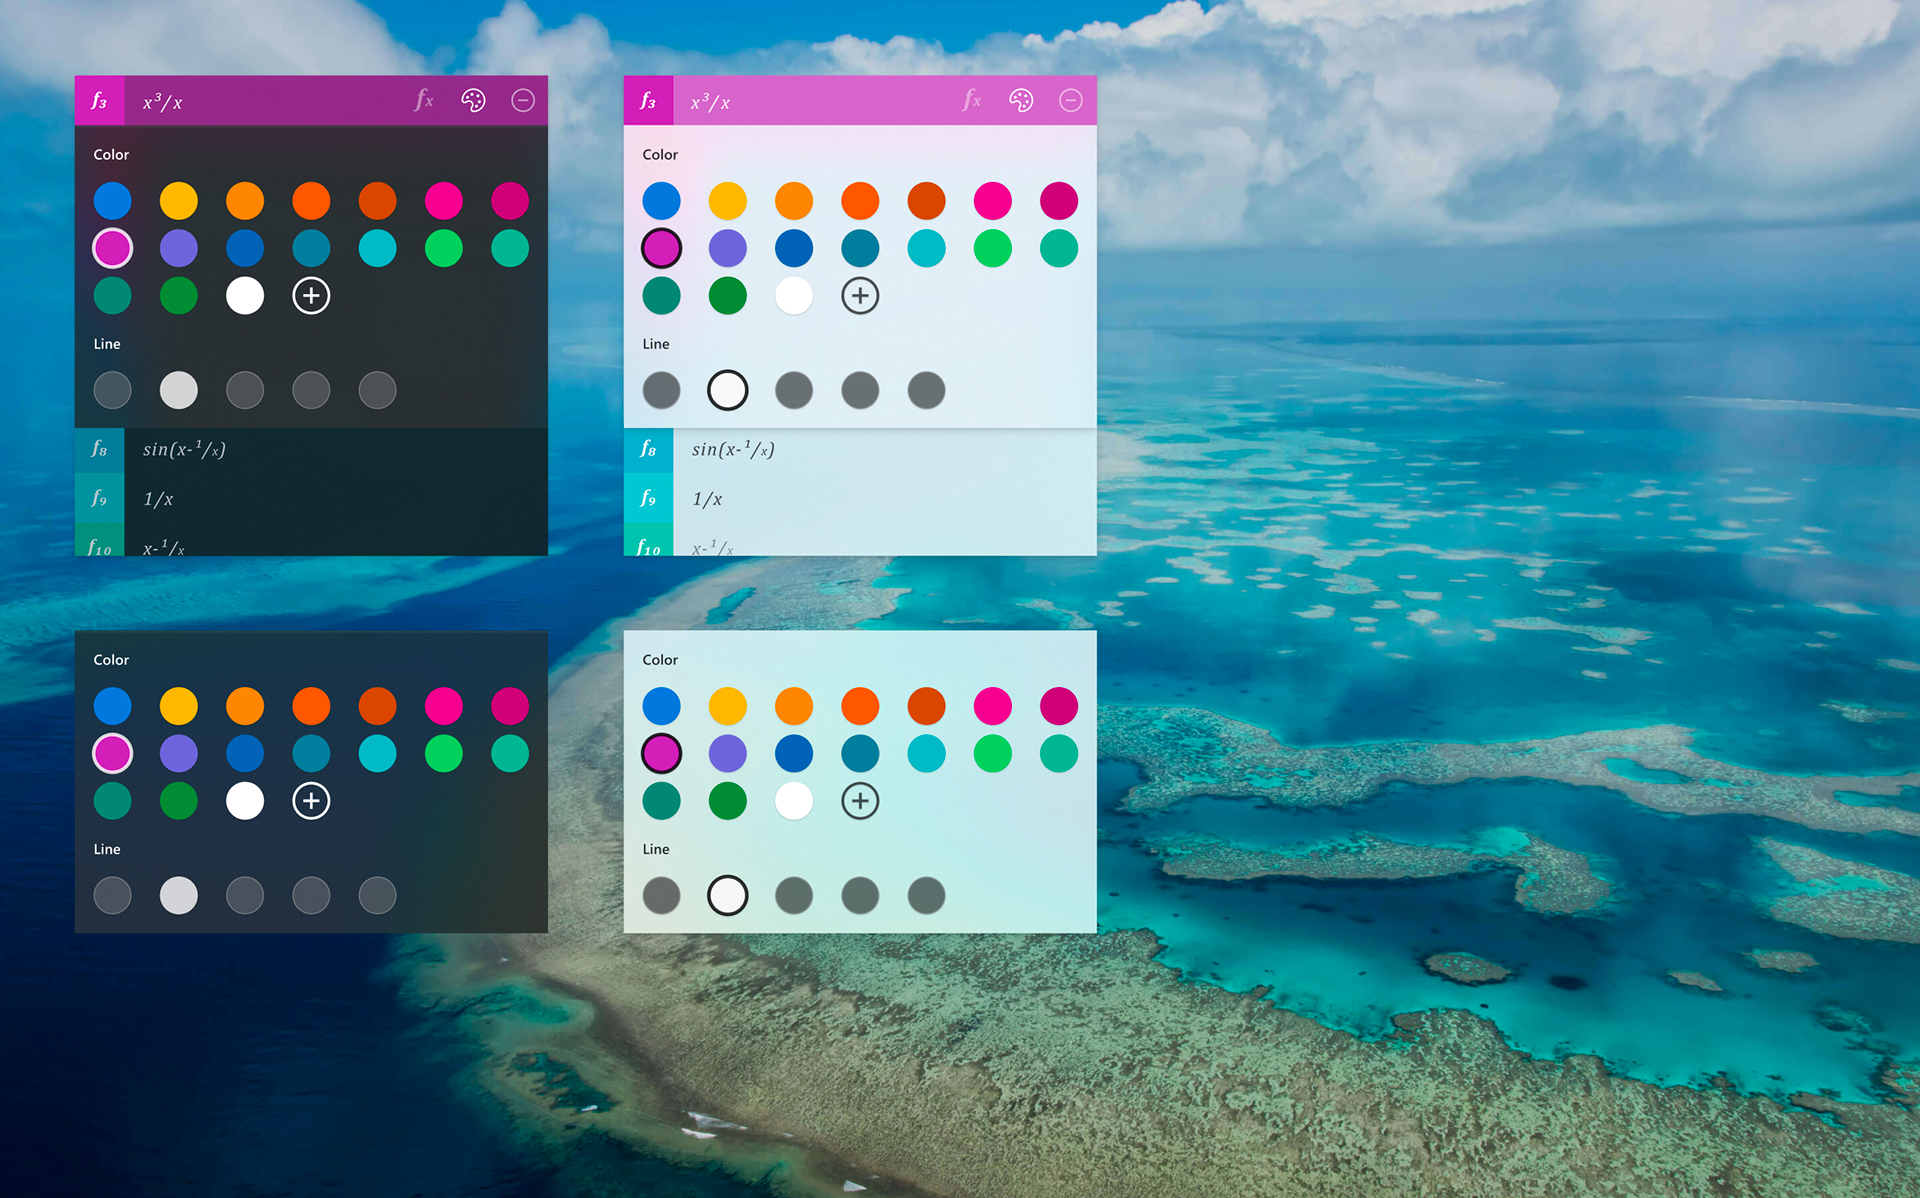
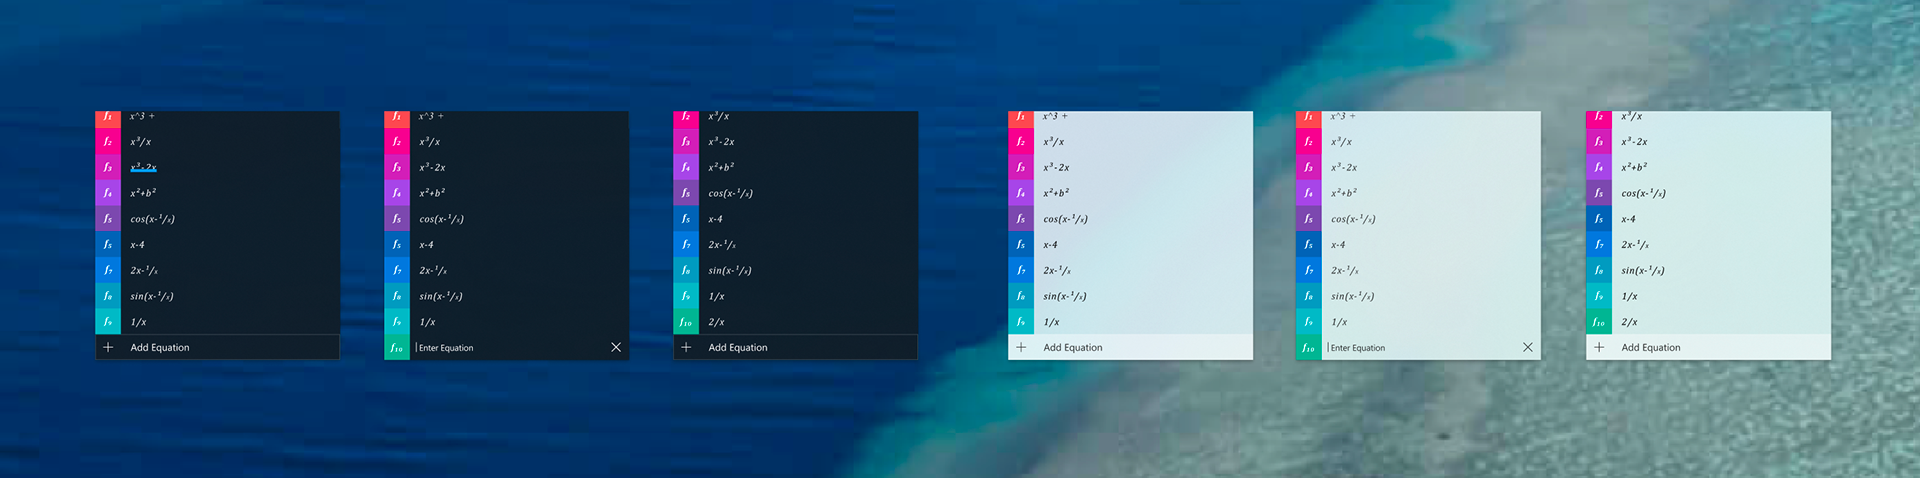
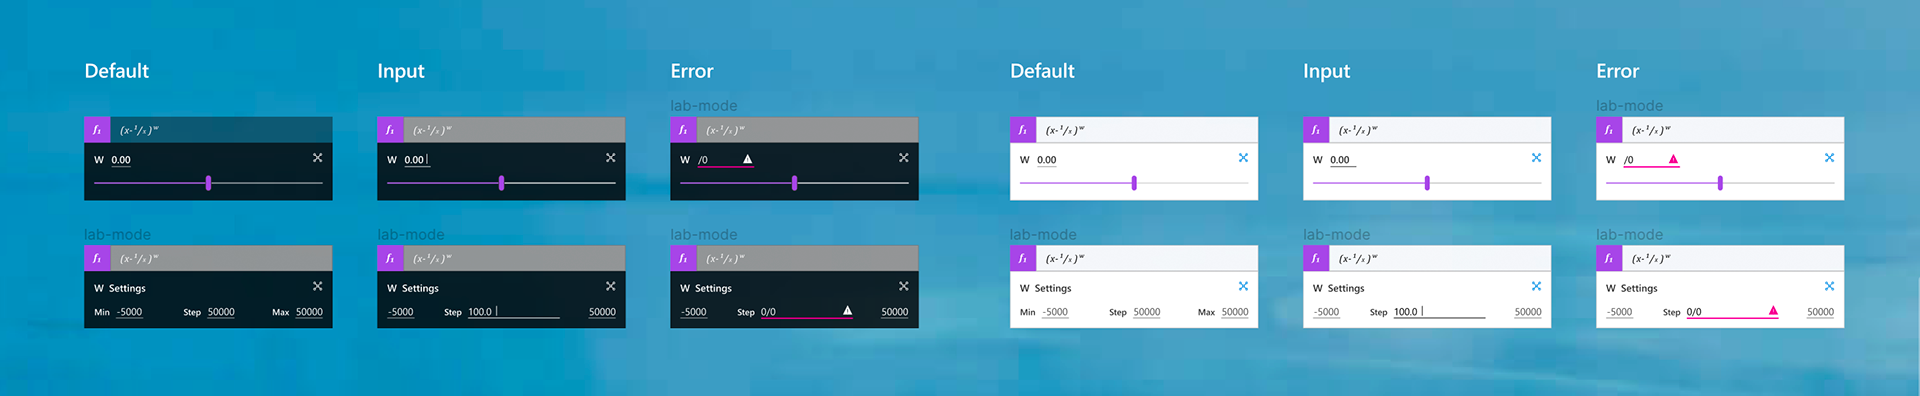
Final Product
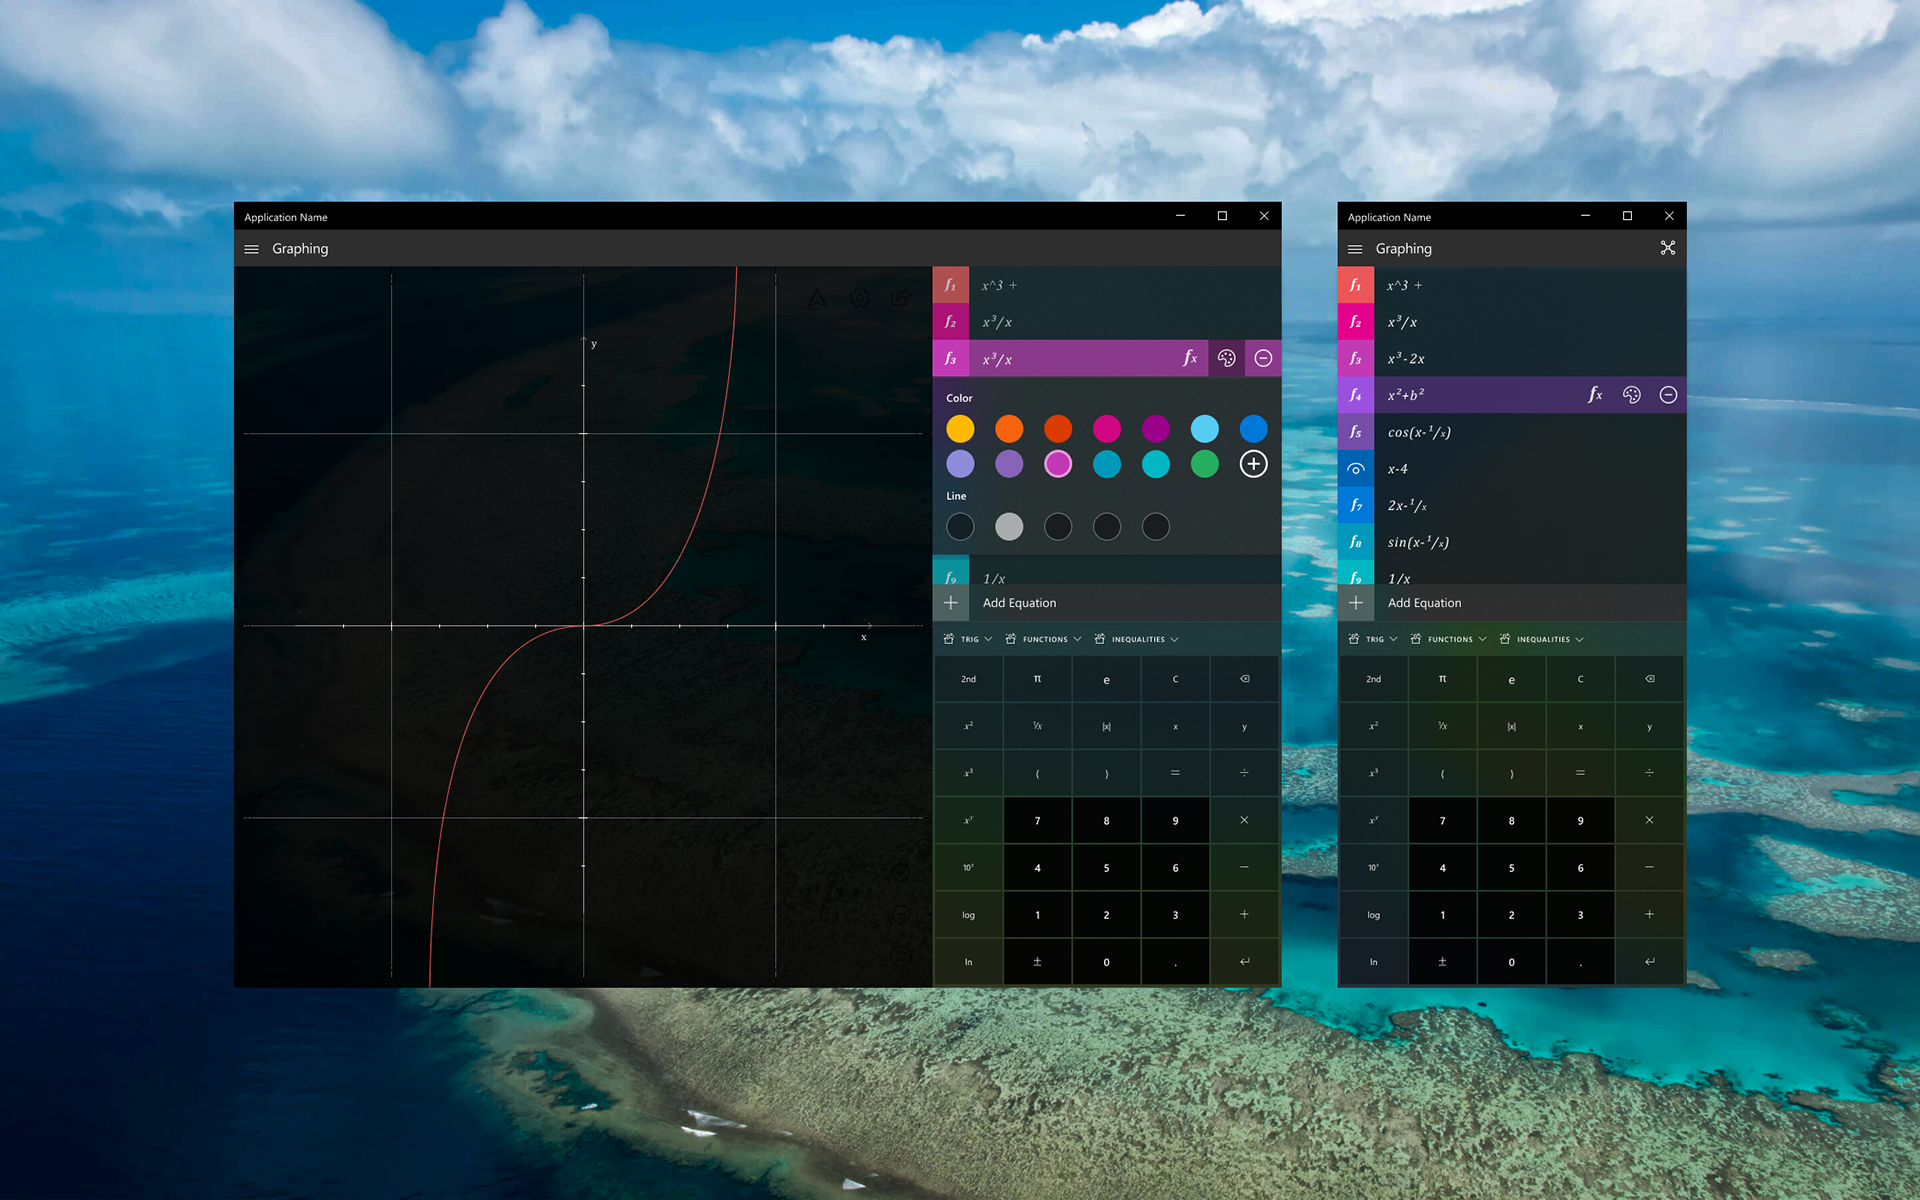
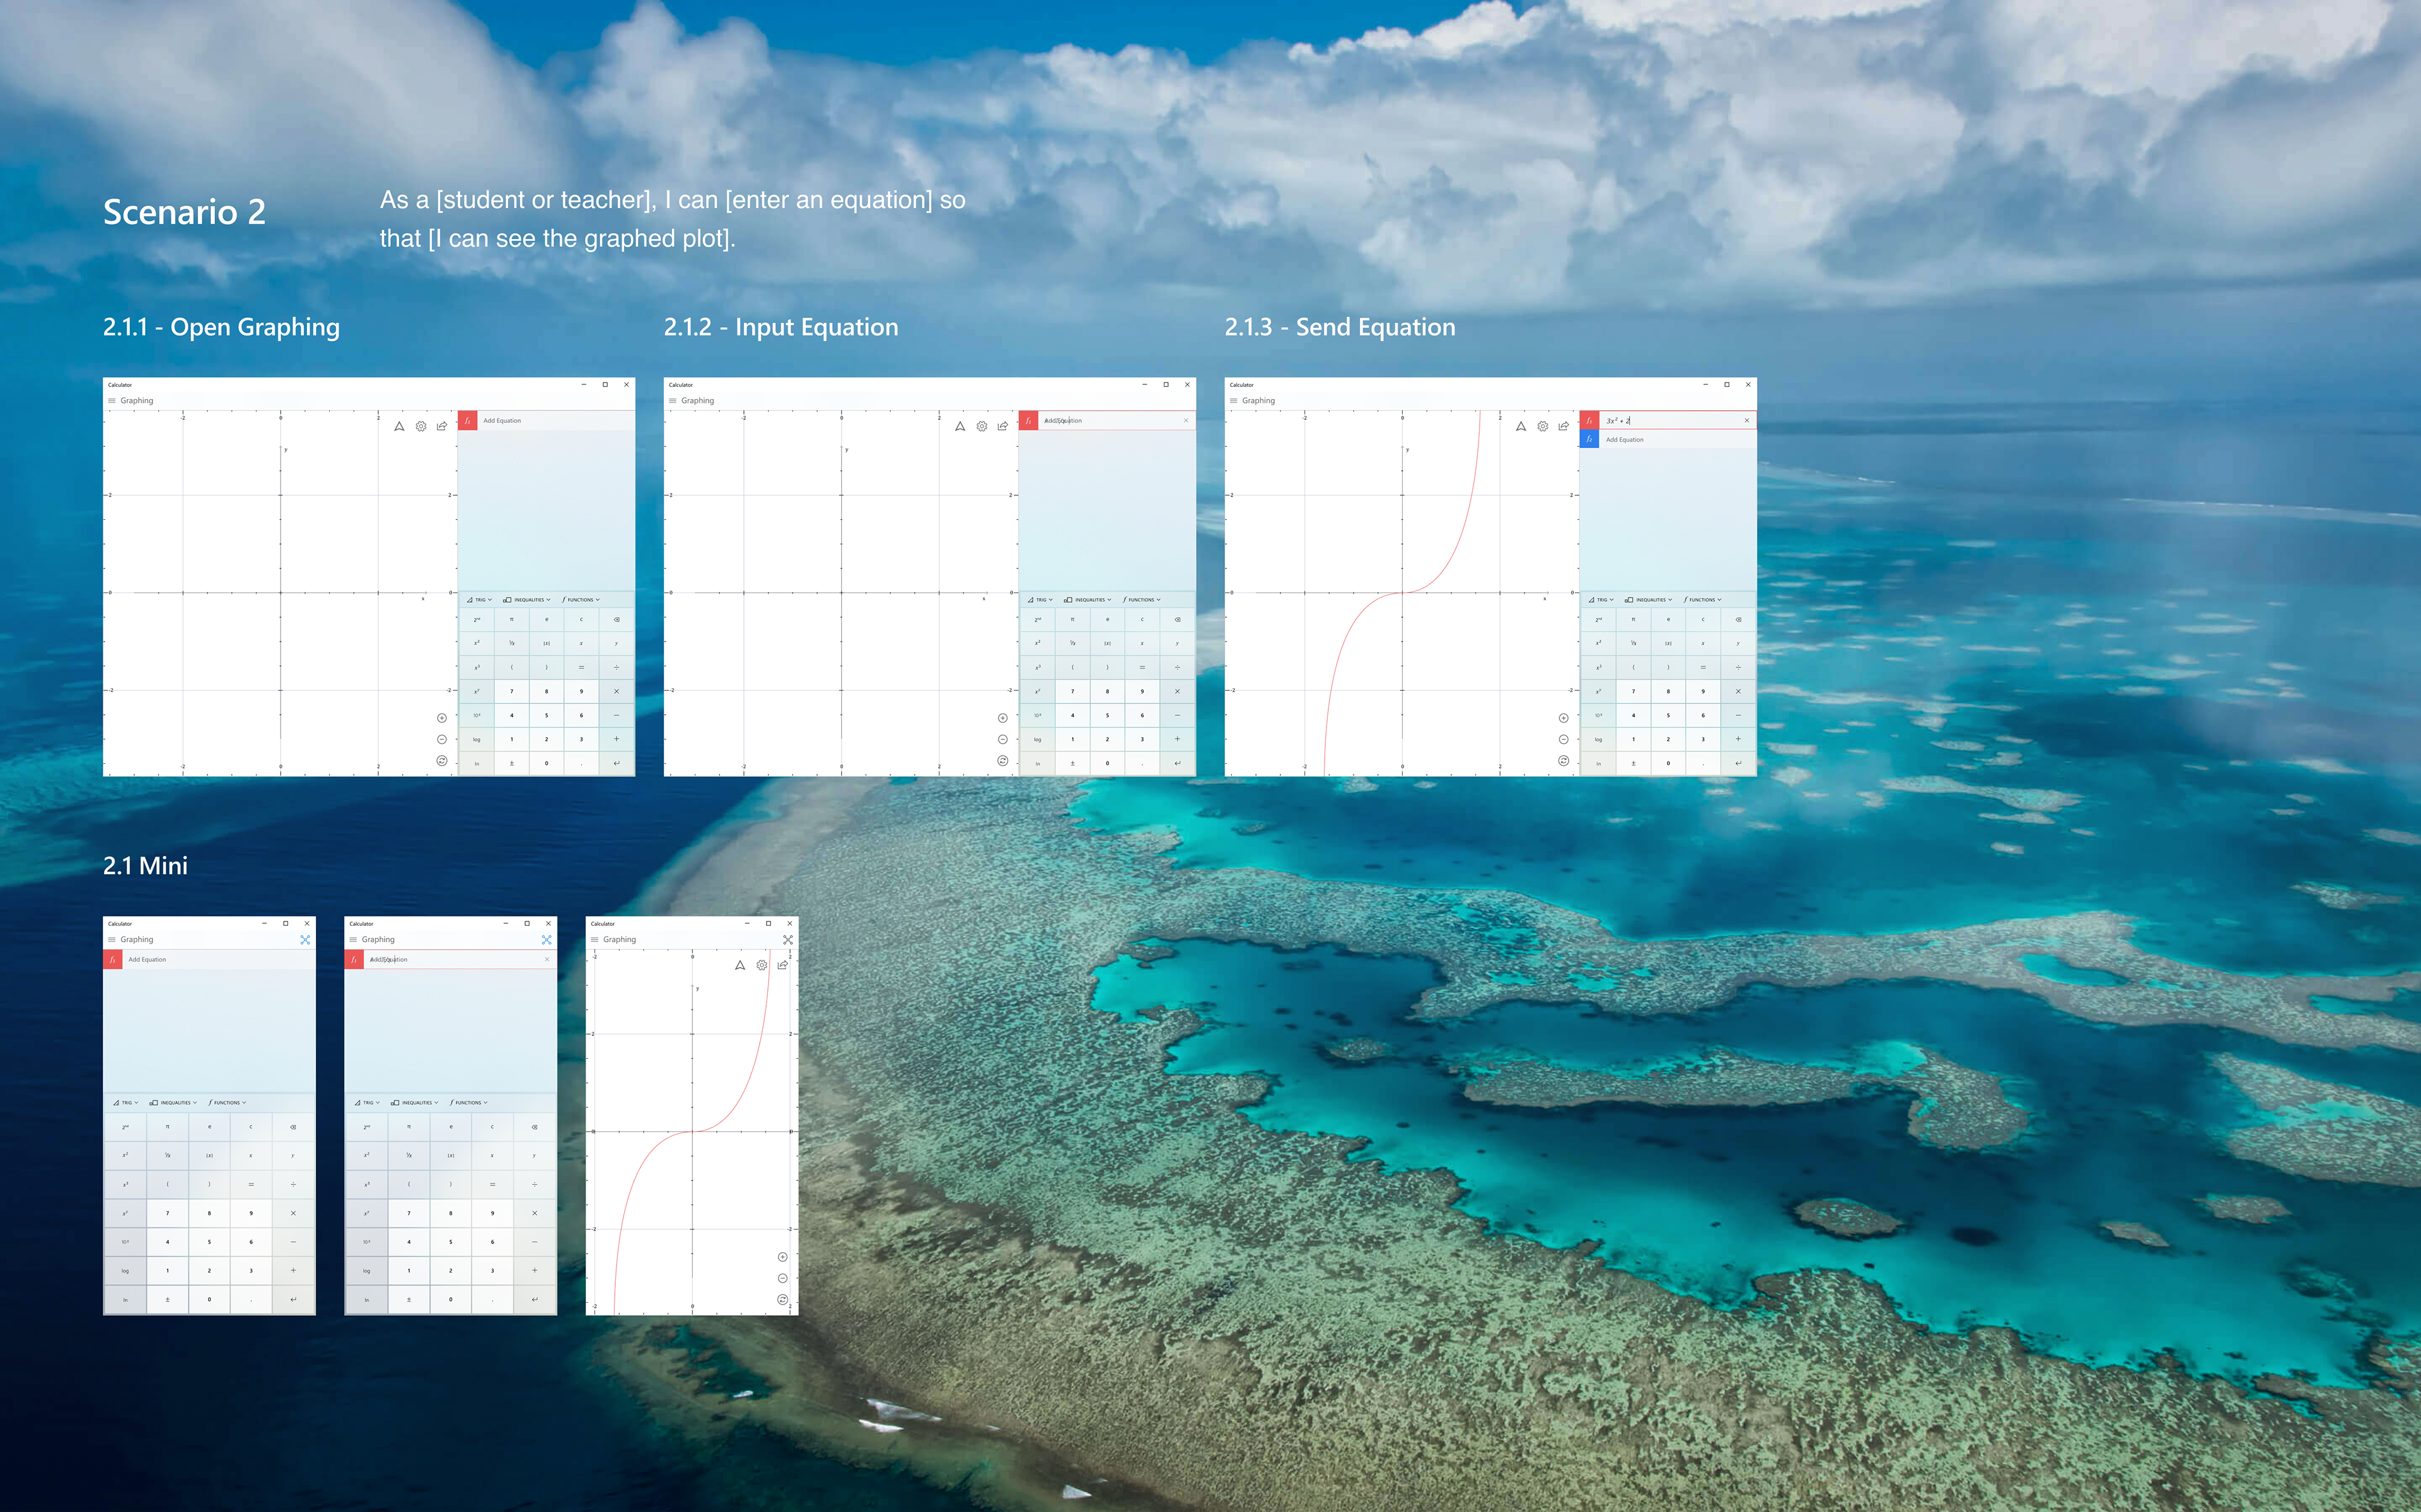
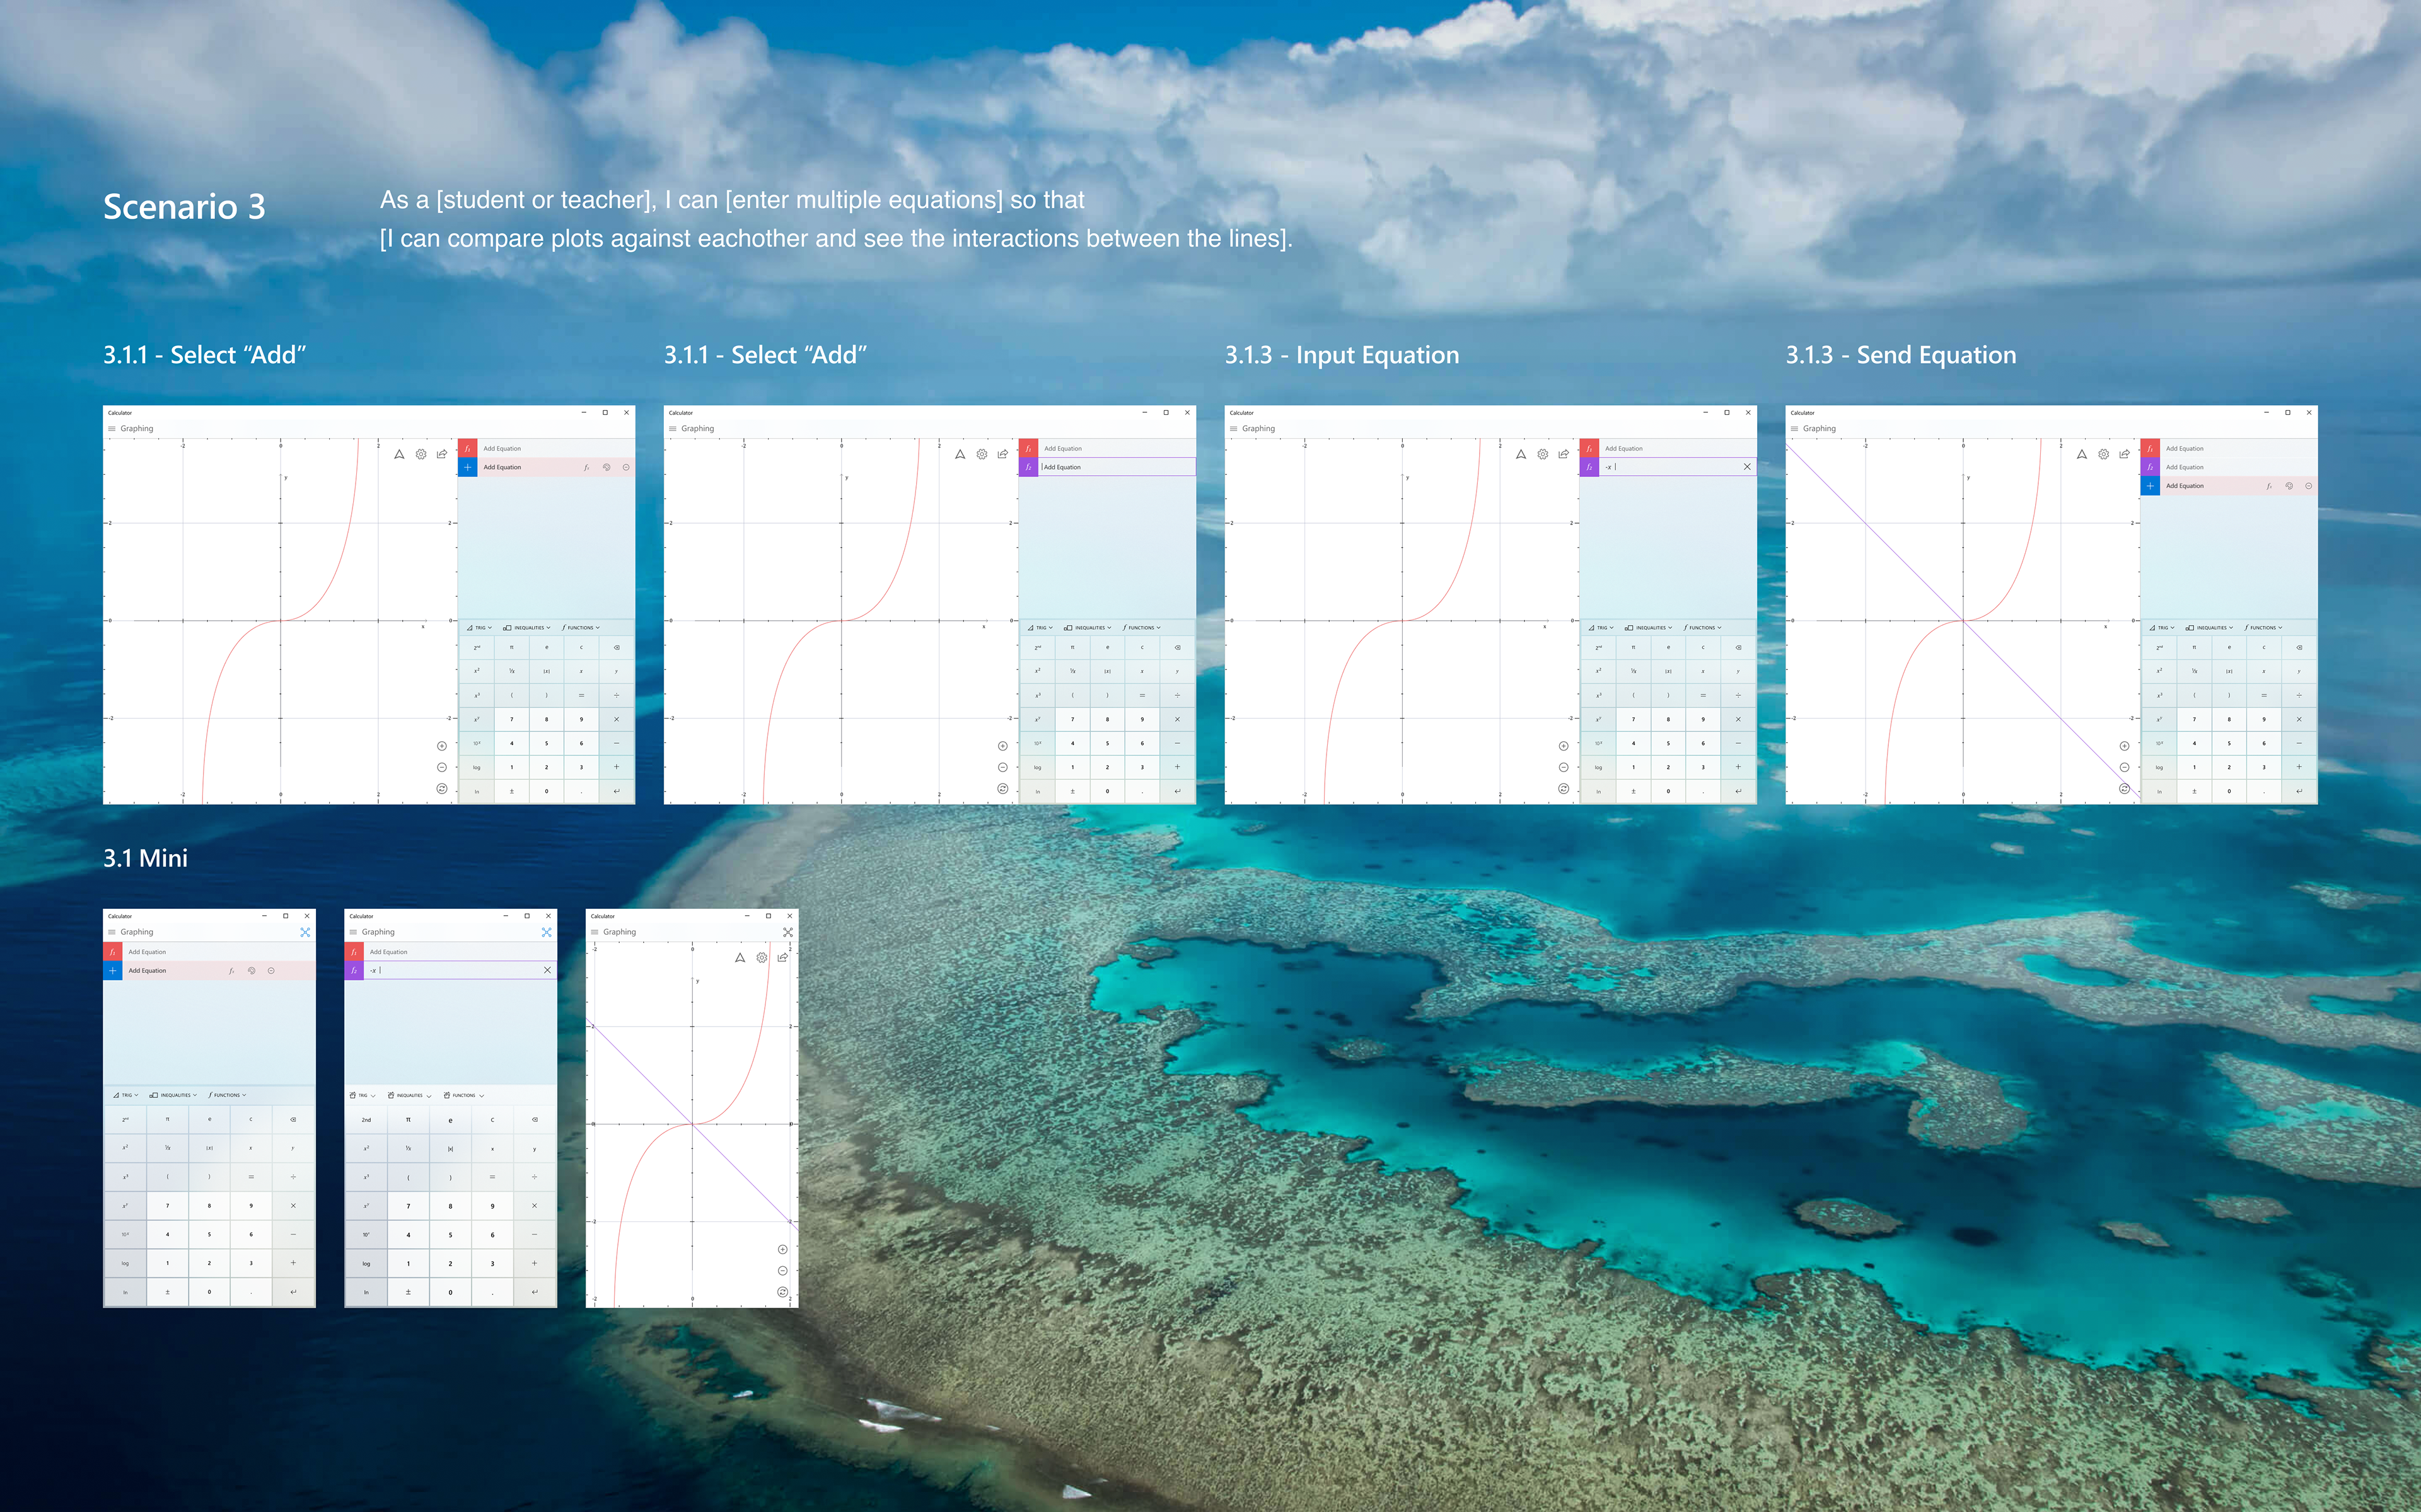
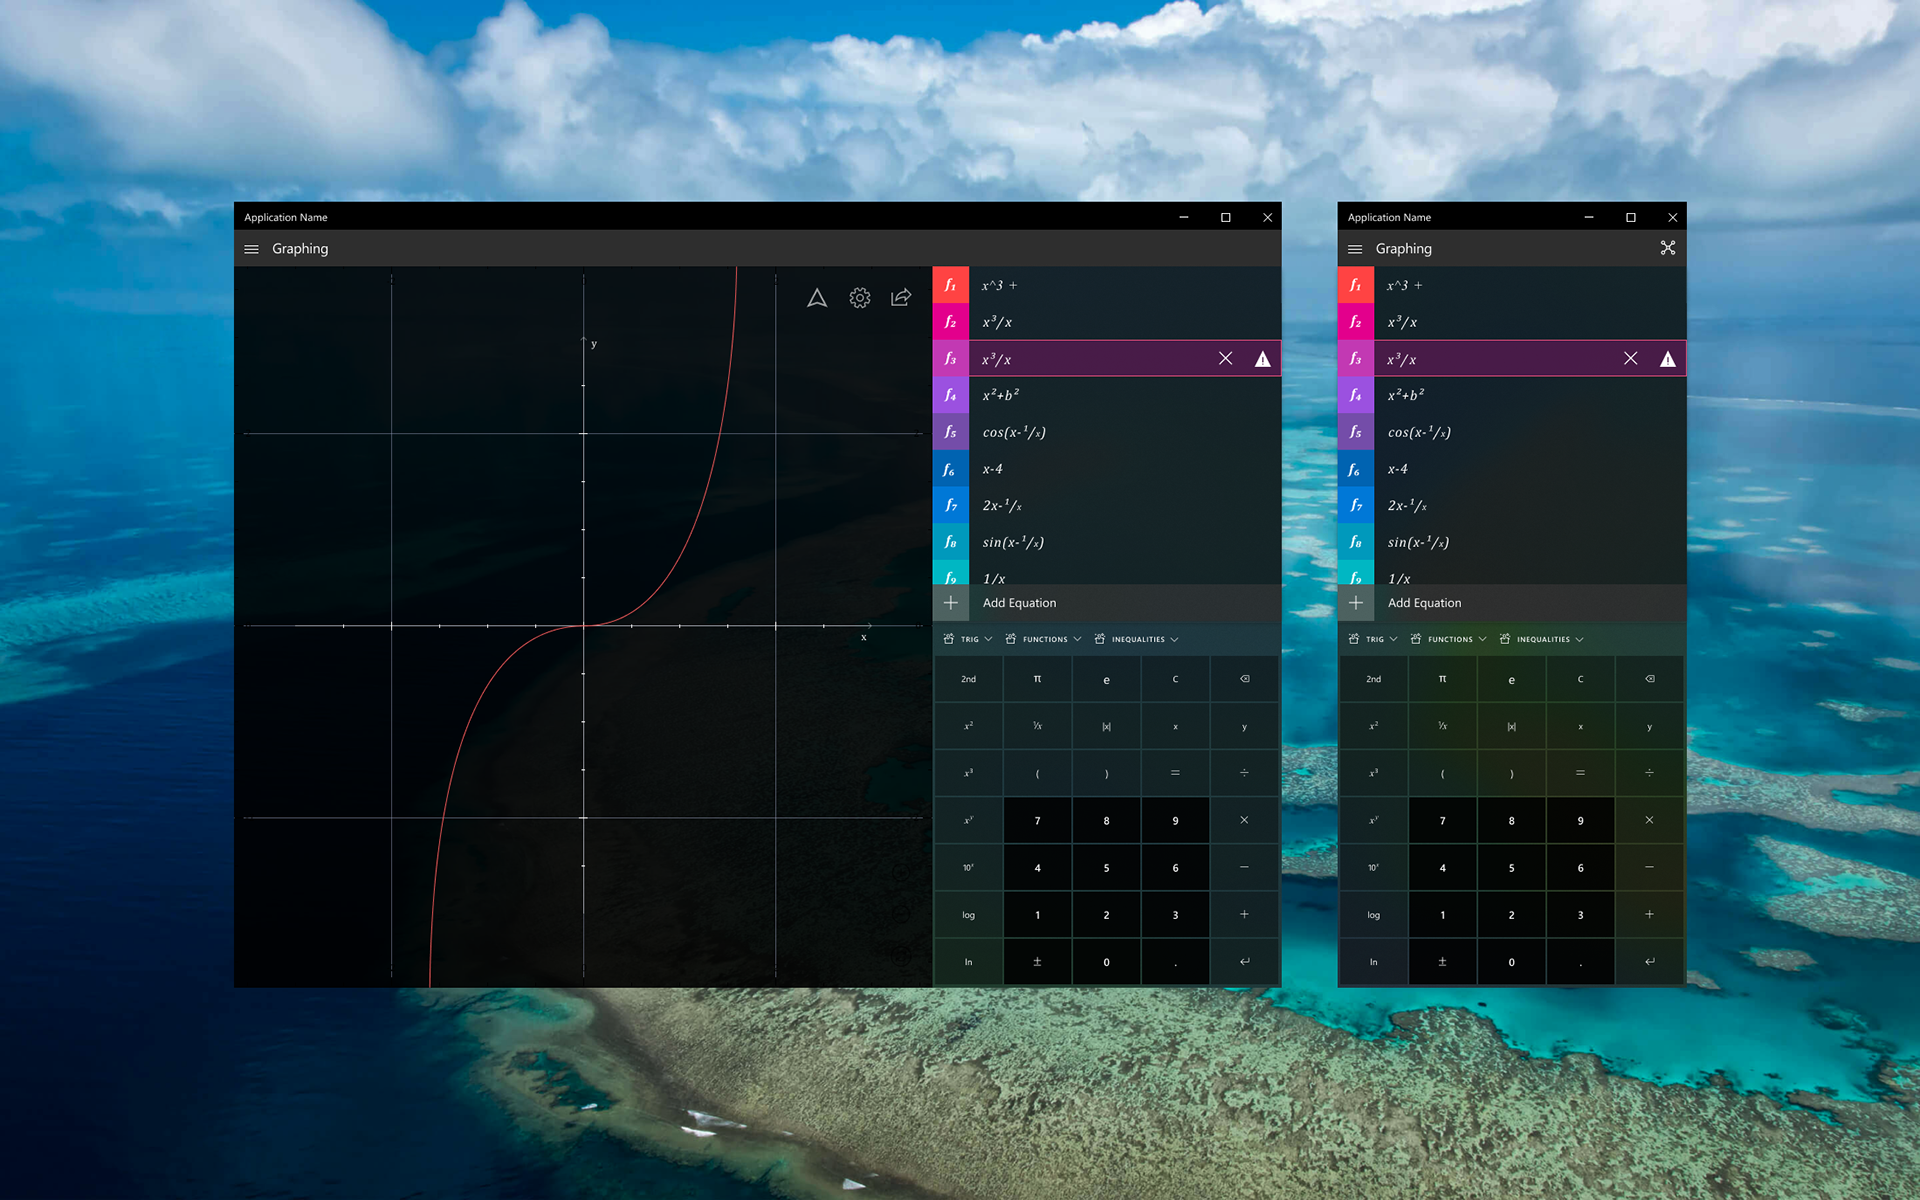
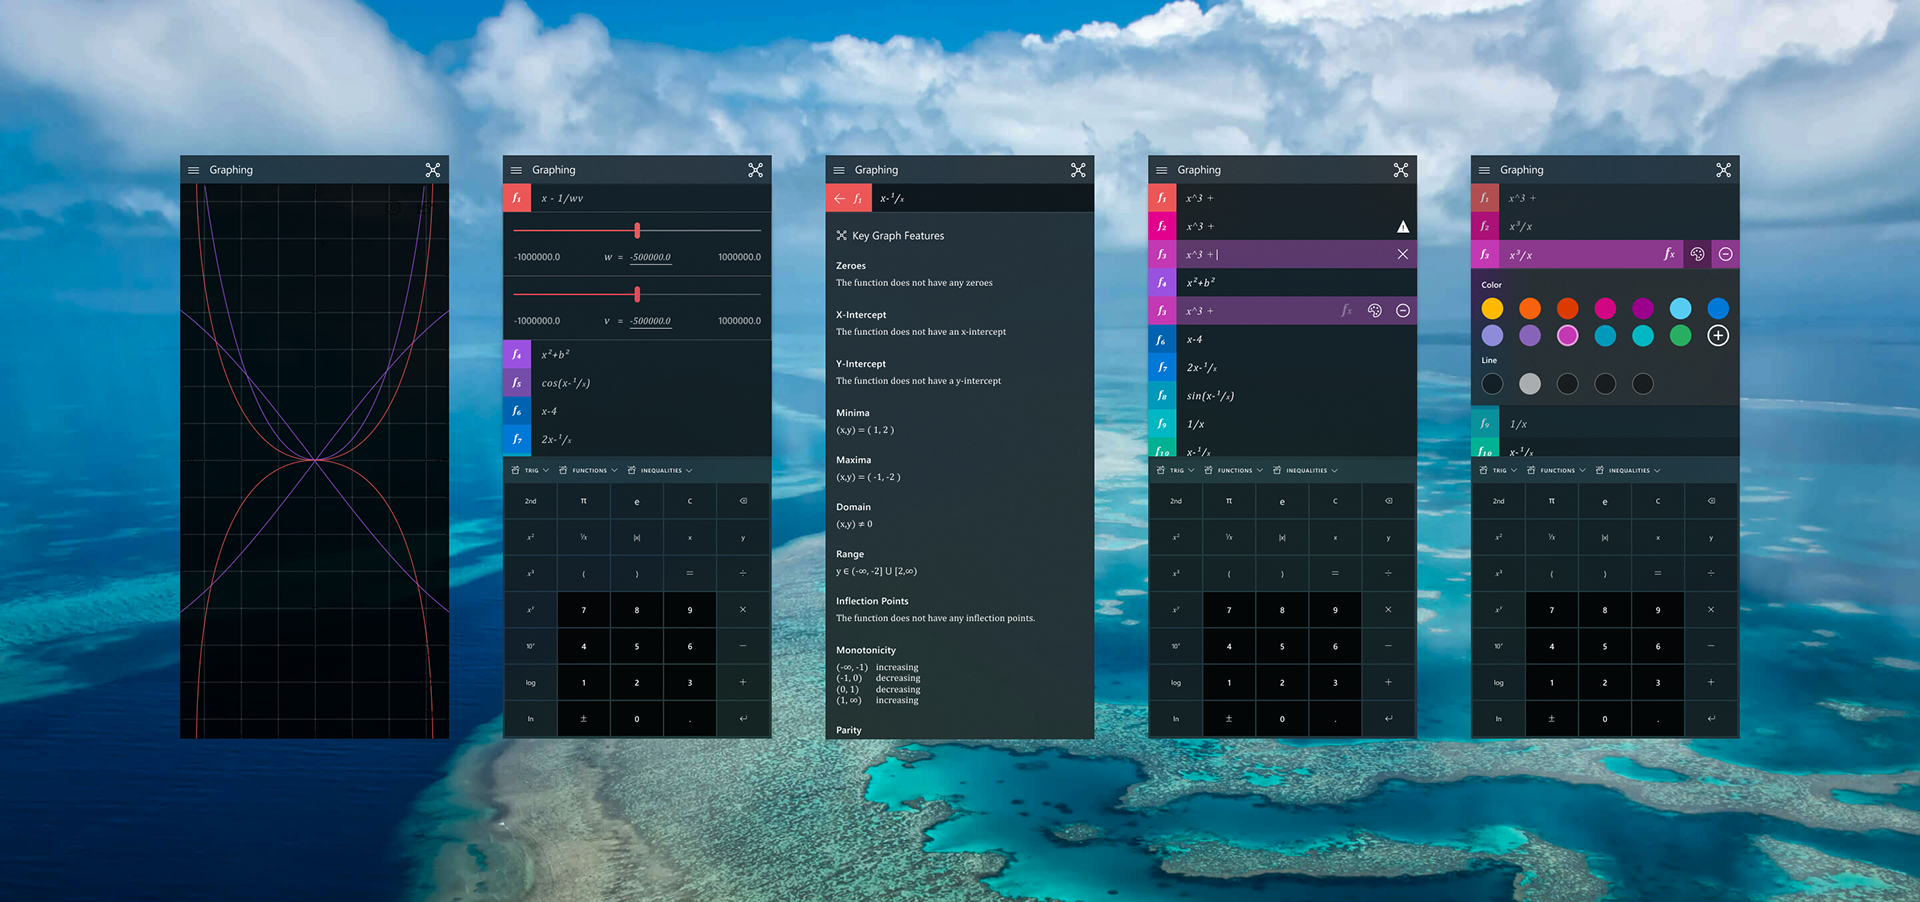
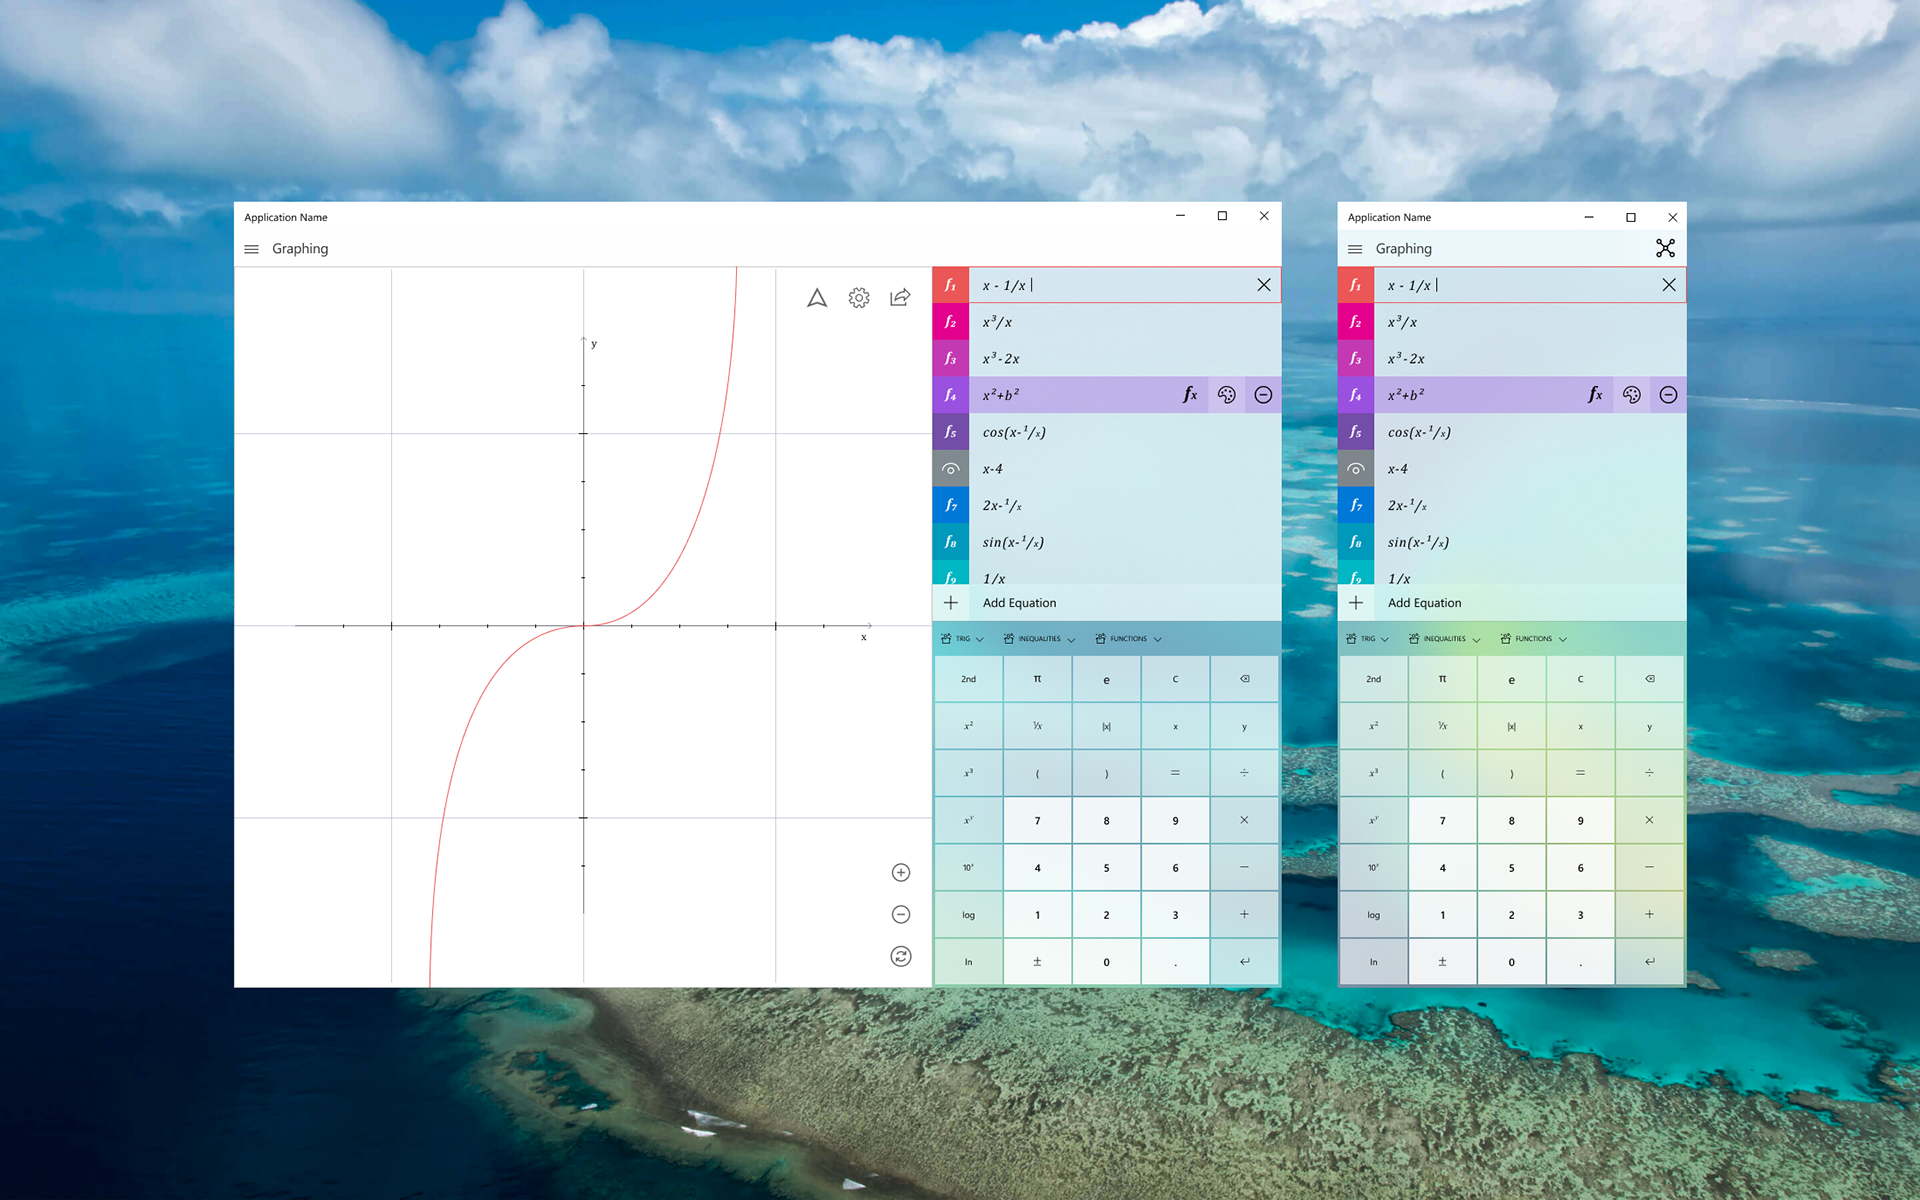
The final version of our graphing calculator is a significant improvement upon what previously existed. It allows for users to interact with equations in a way that was never before possible via Microsoft software. The open source solution is available Q3 of 2019.
------- BELOW THE LINE -------